
How data analytics can improve hiring decisions: a 2027 guide
Use hiring data to pick better sources, score every candidate on skills, spot bias early and link pre-hire scores to how new hires perform.

Most hiring decisions are made in the first few minutes of an interview and justified for the rest of it. That is a problem when every wrong hire costs months of salary, lost output, and a second search.
Resumes show where someone has been, not what they can do. Interviews reward confidence over competence. And without numbers, nobody can say which sourcing channel, screening step, or interviewer is producing your best people.
Data analytics changes that. In this guide, you will learn which hiring metrics matter, how to turn assessment and pipeline data into better shortlists, and how to build a process where each decision is backed by evidence you can defend.
TL;DR:
- Data analytics improves hiring decisions by scoring every candidate against the same skills bar and showing which channels, questions and stages lead to hires who perform and stay.
- Start with three metrics: source of hire, assessment pass rate and quality of hire. A few numbers you act on beat a dashboard nobody reads.
- Assess skills before the first recruiter call, so interviews test judgment and fit instead of repeating basic screening.
- Quality of hire is the metric that matters most and the one teams measure least well: LinkedIn found 89% of TA pros say it will matter more, but only 25% feel highly confident measuring it.
- Data does not erase bias. It makes bias visible, stage by stage, so the team can fix the step that causes it.
- If an automated tool scores candidates, NYC Local Law 144 requires a yearly bias audit and candidate notice, and the EU AI Act treats hiring AI as high-risk. Keep a person on every rejection.
 ChatGPT
 Gemini
 Claude
 Grok
 Perplexity
What is data-driven hiring?
Data-driven hiring is the practice of using measured evidence, such as skills assessment scores, structured interview ratings, funnel conversion rates and post-hire performance, to decide who moves forward at each stage. The team sets a measurable standard before it reviews any candidate and then judges everyone against that standard in the same way.
The difference from traditional hiring is the order of decisions. In a data-driven process, the hiring manager looks at evidence first: scores, benchmarks and skill gap reports. The interview then tests what a score cannot show. Without that order, a 45-minute conversation carries the whole decision, and it was never built to do that alone.
The pressure to get this right is real. SHRM's Talent Trends research found that 69% of organizations still struggle to fill roles. Data also widens the pool: LinkedIn's Skills-Based Hiring 2025 report found that searching on skills instead of job titles gives a median 6.1x larger talent pool worldwide. That is the core idea of skills-based hiring.
Factor | Gut-feel hiring | Data-driven hiring |
|---|---|---|
Basis of the decision | Resume, rapport, first impression | Skills scores against a bar set in advance |
Consistency | Varies by interviewer and by day | Same questions and scoring for everyone |
Bias risk | High and hard to see | Lower, and every step leaves a trail you can audit |
Speed | Many screening calls per hire | Shortlist ranked before the first call |
When a candidate asks why | "We went another way" | A score and the skill gap behind it |
Learning over time | None | Scores compared with performance after the hire |

What are 8 examples of how data analytics can improve hiring decisions?
Data analytics improves eight hiring decisions most: where to source, how to write the job post, who passes screening, how interviews are scored, who is likely to succeed, whether the process is fair, where the funnel stalls, and how many people to hire and when. Each one swaps a guess for a number someone can check.
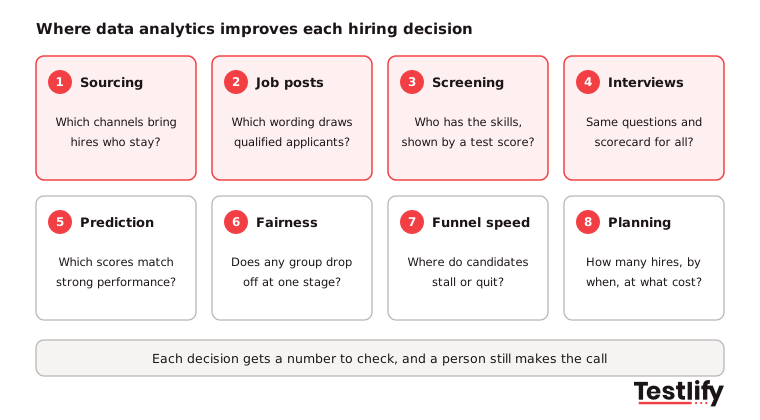
1. Choose sourcing channels by the quality of hires they bring
Source-of-hire data shows which job boards, referral programs, agencies and campus events produce hires who pass probation and stay, not just the most applicants. A cheap channel that sends weak candidates costs more than it saves once you count screening time and re-opened roles. Track cost per qualified candidate as well as cost per hire.
2. Write job posts that attract the people you need
Application and pass-rate data by job post shows which titles, requirements and wording draw qualified applicants. If most applicants keep failing the same skill test, the post may be attracting the wrong profile, or asking for a degree the work does not need. Skill gap reports from past candidates tell you which requirements to state more clearly.
3. Screen on skills instead of resume keywords
Scoring every applicant on a role-specific test turns screening into a ranked list. Recruiters stop reading hundreds of resumes and start with the people who can already do the work. Resume screening tools can help with volume, but a skills score is evidence of ability, while a resume is a claim about it.
4. Make interviews consistent and comparable
A structured interview gives every candidate the same questions and the same scorecard. Once interview ratings are recorded as numbers, analytics shows which questions separate strong candidates and which interviewers score far above or below their peers. Both are easy to fix once they are visible.
5. Predict who is likely to succeed
Predictive analytics compares the pre-hire scores of past hires with how they performed and how long they stayed. The skills and score ranges that match strong performers become the bar for the next round of hiring. The same history helps spot future leaders inside the company for succession planning and shapes your employee retention strategies.
6. Check that the process is fair
Pass rates broken down by stage and by group show where any group of candidates falls behind. If one group passes the skills test at the same rate but drops off after the phone screen, the phone screen is the problem. Without the data, the team would never know which step to fix.
7. Fix bottlenecks and candidate drop-off
Stage-by-stage conversion and time data show where candidates stall, such as a long wait for interview feedback, or where they quit, such as a 90-minute application form. Shorter, clearer steps keep strong candidates who have other offers. A short candidate survey after each stage adds the reason behind the numbers.
8. Plan hiring and prove ROI
Historical time-to-fill, offer acceptance and attrition data let the team forecast how many hires it needs, how early to open roles and what each hire will cost. The same numbers show leadership which tools and channels pay back, so budget goes where it improves the quality of hire.
Which hiring metrics should you track?
The hiring metrics worth tracking fall into three groups: speed and cost (how fast and cheaply roles fill), quality (how well hires perform and how long they stay) and process (whether every candidate meets the same standard). The eight metrics below cover all three and tie each number to a decision.
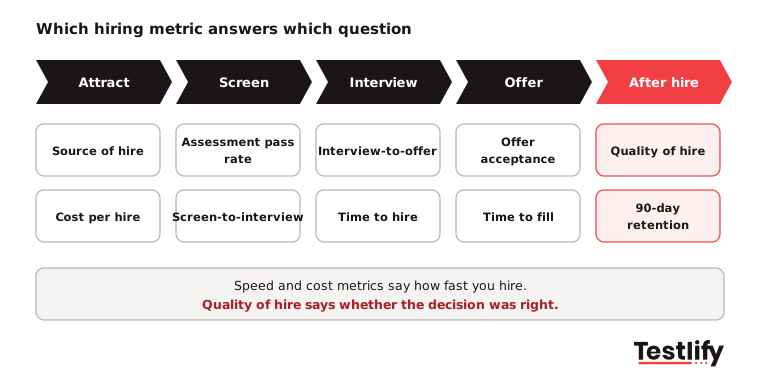
Metric | What it measures | The decision it changes |
|---|---|---|
Quality of hire | Performance ratings, 12-month retention and hiring manager satisfaction | Which sources, tests and score bars to keep |
Time to fill | Days from requisition open to offer accepted | When to open roles and where the process is slow |
Time to hire | Days from first contact to offer accepted | Which internal steps to cut or speed up |
Cost per hire | Total recruiting spend divided by hires | Where to move budget |
Source of hire | Which channels produce hires, and how good they are | Which channels to grow or drop |
Assessment pass rate | Share of candidates who meet the skills bar | Whether the bar is too low, too high or measuring the wrong skill |
Stage conversion | Share of candidates who move from each stage to the next | Which stage loses good candidates |
Offer acceptance rate | Share of offers accepted | Whether pay, speed or candidate experience needs work |
For a benchmark, SHRM's latest recruiting benchmarking data, drawn from over 4,600 organizations, puts the median time to fill for nonexecutive roles at 39 calendar days. It also found that extra-large organizations saw a 67% rise in median requisitions per recruiter, which is why manual screening breaks down first in large teams.
Watch for warning signs rather than chasing one perfect number. A pass rate near 100% means the test is too easy to separate candidates. A very low offer acceptance rate usually points to pay or a slow process. You can work out your own figures with the Testlify quality of hire calculator and cost per hire calculator.
Key takeaway: More metrics do not make better hiring. Teams that track a handful consistently learn more than teams that track twenty now and then. Build the habit on one role type with three metrics before you expand it.
What data feeds hiring analytics?
Hiring analytics draws on five main data sources: the applicant tracking system (applications, stages, dates, sources), skills assessments (scores per skill, benchmarks), structured interview scorecards, HR records after the hire (performance ratings, retention, promotions) and labor-market data (salary ranges, skill demand). The value comes from joining them, so a pre-hire score can be read next to a 12-month review.
Teams usually grow through three levels of recruitment analytics:
- Descriptive: What happened? Time to fill, pass rates and source mix, reported each month.
- Diagnostic: Why did it happen? Drop-off by stage, pass rates by group, interviewer score spread.
- Predictive: What is likely next? Which score ranges match strong performers, and how many hires next quarter.
Data quality decides how far you get. Stages that are not logged in the ATS, free-text interview notes and performance ratings that everyone scores as "meets expectations" all weaken the analysis. Small samples are another limit: ten hires is enough to spot a broken step, not enough to build a reliable prediction.
Leave out data that is not job-related. Scanning candidates' social media profiles for "culture fit" adds privacy risk and tends to bring bias back in. Use a work-style or culture test that every candidate takes in the same way instead.
How do you build a data-driven hiring process?
Building a data-driven hiring process takes five connected steps: set a measurable skills bar before the role opens, assess every applicant before the first call, track conversion at every stage, log cost and time by source, and compare post-hire performance with the pre-hire scores. The last step feeds back into the first.
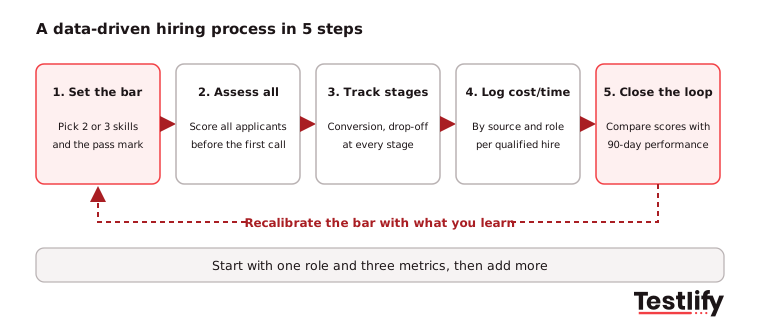
- Set the bar before the role opens: Pick the two or three skills that actually separate a strong hire from an average one in this role, and decide the pass mark before you see a single application, so the standard cannot shift with who applies.
- Assess the whole pool before the first call: Score every applicant on those skills with the same test. The shortlist then holds people who can already do the work, and interview time goes to judgment and fit.
- Track conversion at every stage: Record how many candidates move from application to assessment, assessment to interview, interview to offer and offer to acceptance. A stage with heavy drop-off has a process problem or a sourcing problem, and the data shows which.
- Log cost and time by source and role: Track cost per qualified candidate, not only cost per hire, to see which channels deserve the budget.
- Close the loop after the hire: At the 90-day and 12-month reviews, compare each employee's performance with their original scores. Recalibrate the bar and the test where the two do not line up.
Pro tip: Do not try to measure everything at once. Score the few skills that matter hard and leave the nice-to-haves for the interview. A focused 30-minute assessment beats a long one nobody finishes.
If you are short on time, start with how to reduce the time to hire and how to improve quality of hire, the two outcomes most teams want first.
What does data-driven hiring look like on one role?
Data-driven hiring on one role means the skills test comes before the recruiter call, the hiring manager sees a ranked shortlist before any conversation, and every decision has a documented reason. Here is an illustrative example with round numbers for a customer support role.
- Before: 400 applicants, resumes read by hand, 60 phone screens, 20 interviews, 4 hires. Most recruiter time went into screening calls that a 30-minute test would have answered.
- After: All 400 applicants take a support skills test with a typing and chat simulation. The top 40 by score get a phone screen and 12 reach the interview. The team still makes 4 hires, from a shortlist where everyone has already shown the core skills.
- Three months later: The team compares the 4 hires' scores with their quality scores and handling time. If the best performers scored highest on the chat simulation, that section gets more weight next time.
The numbers will differ for every team. The pattern holds across roles: assess at the top of the funnel, not the middle, and check the result against real performance.
How does data analytics reduce bias in hiring?
Data analytics reduces bias by making every candidate clear the same measurable bar and by showing where the process treats groups differently. When the team decides on standardized scores instead of unstructured impressions, factors like name, school and rapport carry less weight in who moves forward.
- Same test, same scoring: Every candidate answers role-based questions under the same conditions, graded against the same benchmark.
- Blind first screen: Removing names, photos and other personal details from early review keeps attention on skills.
- Stage audits: Pass rates by stage and group show the exact step where a gap opens, so the team fixes that step instead of guessing.
- Interviewer checks: Score spread by interviewer shows who rates far harder or softer than peers.
- A record for every decision: Each rejection links to a score and a reason, which holds up when a candidate asks or an auditor checks.
Data does not erase bias on its own. A test that measures a skill the job does not need moves the bias somewhere harder to see, and a model trained on past hiring can copy past patterns. Audit what you assess as carefully as who you hire. For more, see how to overcome unconscious bias in hiring.
What are the risks and rules for using hiring data?
Hiring data carries three main risks: privacy (candidate data must be secured and used only for hiring), fairness (biased data or tools can repeat past discrimination) and transparency (candidates should know what is collected and how it is used). Rules in New York City, the EU and other places now turn these into legal duties.
- Privacy and security: Collect only job-related data, encrypt it, limit who can see it and set a retention period. GDPR in the EU and CCPA in California give candidates rights over their data.
- Fairness audits: Under New York City's Local Law 144, employers cannot use an automated employment decision tool unless it had a bias audit within one year of use, a summary of the results is public, and candidates get notice. The city has enforced it since July 5, 2023.
- High-risk AI in the EU: The EU AI Act lists AI used to recruit, select or evaluate candidates as high-risk, which brings duties on risk management, human oversight and record-keeping.
- Transparency: Tell candidates which assessments they will take, how they are scored and how long data is kept. Clear notice also improves the candidate experience.
- Human review: Treat a score as evidence for a reviewer, not as the decision. Keep a person on every rejection.
How do AI and predictive analytics change hiring decisions?
AI and predictive analytics move hiring data from describing what happened to estimating what is likely to happen. Instead of only scoring a candidate's current skill, AI tools can rank candidates, summarize each one's strengths and gaps, and show which score patterns line up with strong performance in a given role.
Adoption is rising fast. LinkedIn's Future of Recruiting 2025 found that 37% of organizations are using or testing generative AI in hiring, up from 27% a year before, and 61% of TA pros believe AI can improve how they measure quality of hire. The same survey found that 93% say assessing skills accurately is crucial to quality of hire, and that teams measure quality mainly through performance ratings (66%), new-hire retention (60%) and hiring manager satisfaction (44%).
AI scoring is only as good as the data and criteria behind it. Teams that get the most from it treat assessment design as ongoing work: they compare scores with post-hire performance on a set cycle, change scoring weights when the job changes, and drop any signal that stops matching real results. Set-and-forget does not work for a predictive hiring model.
How does Testlify support data-driven hiring decisions?
Testlify turns assessment results into a structured, auditable hiring workflow. Hiring teams build a role-specific assessment from a job description, score every candidate automatically, compare each one with global and assessment-level benchmarks, and send results to their ATS, so the decision rests on evidence rather than memory.
- Wide coverage: 3,500+ tests across 50+ industries and 5,000+ roles, plus 25+ question types including coding, chat simulations, video and Voice AI.
- Fits the stack: 100+ ATS and HRIS integrations, including Workday, Greenhouse and Lever, with two-way sync.
- Fair and secure: 20+ proctoring checks, a third-party NYC Local Law 144 bias audit of Testlify's matching model (June 16, 2023), ISO 27001, SOC 2 Type II and GDPR.
- Faster and well received: Testlify reports 55% faster time to hire and 94% candidate satisfaction.
Reporting and analytics dashboard
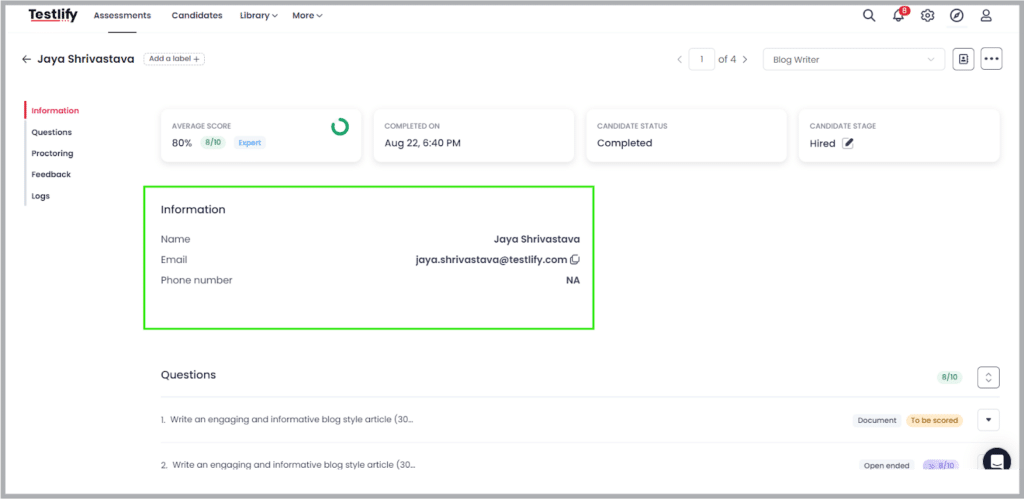
The reporting and analytics dashboard shows each candidate's score next to the global average and the assessment average, so you compare a candidate with the wider pool instead of with the last person you spoke to. Results can be exported as CSV or PDF or shared through a public report link.
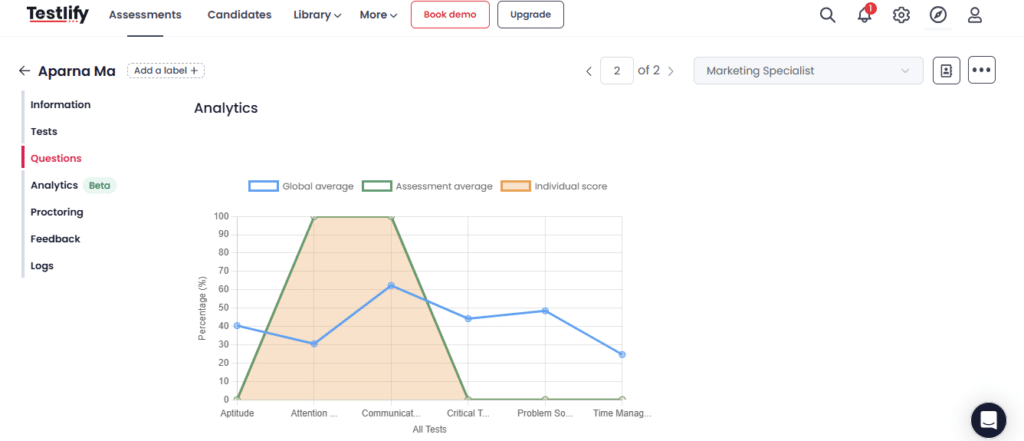
Candidate performance analytics
AI candidate insights break each result down by skill, with AI-written strengths and gaps and suggested follow-up questions for the interview. Weighted scoring lets you count the skills that matter most for the role more heavily, and score thresholds can shortlist candidates automatically.
Skill gap analysis
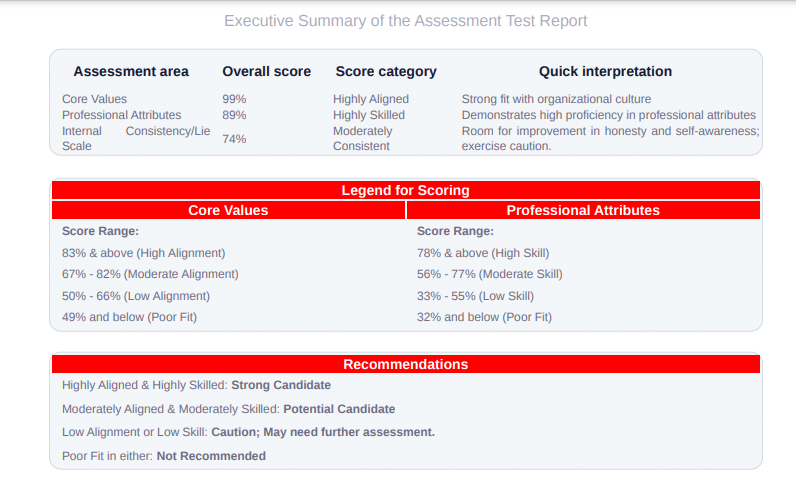
Skill gap analysis shows exactly where a candidate falls short of the role's requirements. Chat simulations and other practical tasks show how a candidate handles a realistic situation. Use the gap reports to plan onboarding for the person you hire and to sharpen the job post when the pool keeps missing the same skill.
Culture and work-style fit
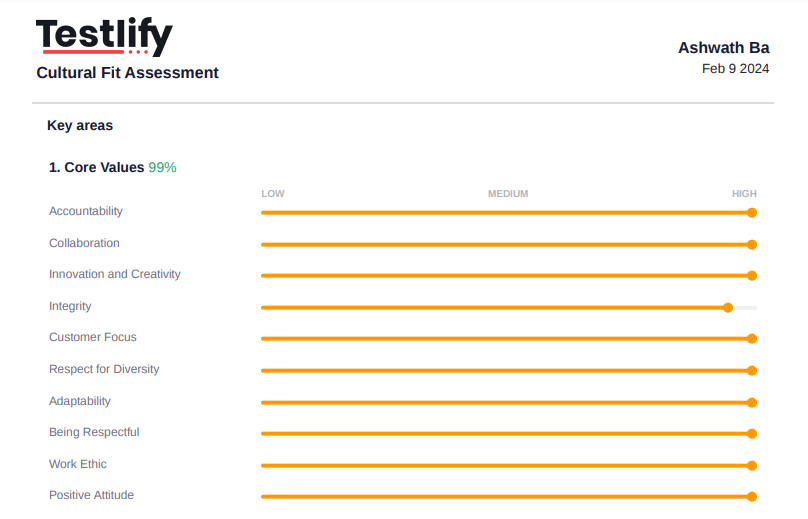
Personality and culture tests measure values and work style the same way for every candidate. Used carefully, they check how someone likes to work without turning into a "hire people like us" filter.
Custom reports
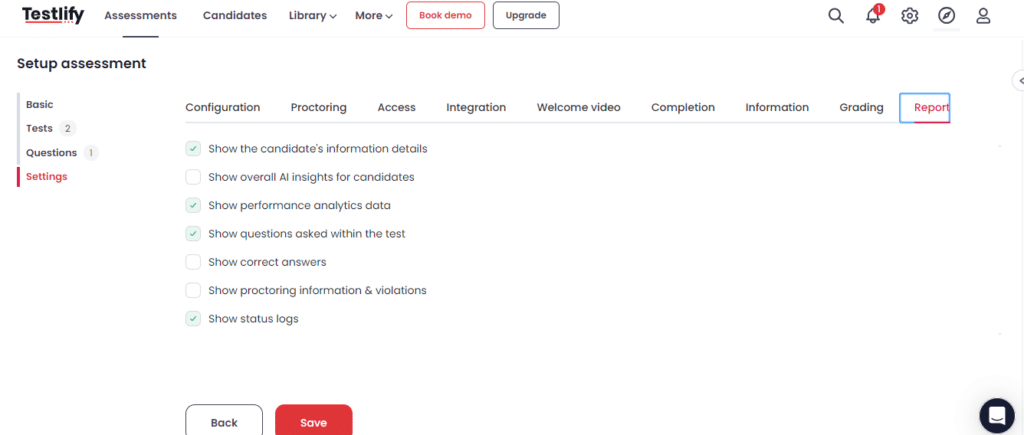
Question analytics, timestamped logs, proctoring flags and a multi-assessment drop-off report show where candidates struggle or leave, so the people reviewing candidates see the numbers that matter to them.
See how data analytics can improve hiring decisions on your own roles
Pick one open role this week. Choose the two skills that matter most, set the bar and score the whole pool before the first call. Start a 7-day free trial of Testlify, no credit card required, or book a demo to see scorecards and analytics on your own roles. You can also browse the test library to find a test for the role.
Frequently asked questions (FAQs)

People and Talent Partner
Arushi Shah runs day-to-day talent acquisition and candidate experience at Testlify. She writes on interviewing, structured hiring, and giving candidates a fair, fast process.
LinkedInRelated resources
View all
HR & recruitment
Talent acquisition KPIs: 14 metrics to track in 2026

HR & recruitment
ATS integration meaning: what it is, how it works and examples

HR & recruitment
Avoiding common pitfalls in ATS integration

HR & recruitment
Measuring the ROI of ATS integrations: Formula, metrics, & example

HR & recruitment
Mastering the art of pre-employment assessment methods

HR & recruitment
Elevate your hiring process with pre-employment testing
Get started.
Hire on proof, not resumes.
Run your first skills-based assessment free — no credit card required.