
How to manage compensation and benefits costs in 2026
See where compensation and benefits money goes, why costs keep rising into 2027 and eight practical ways HR teams can manage the spend.

Compensation and benefits cost more than the salary on any offer letter, and most budgets still underestimate the gap. For US private employers, benefits alone make up about 30% of total compensation costs.
Health benefit costs are projected to rise 8.2% in 2027, while salary budgets sit near 3.4%. That gap decides how much room you have left for pay, hiring and retention.
This guide shows where the money goes and why costs keep rising. It then gives eight practical steps to manage the spend without losing the people you want to keep.
TL;DR
- What compensation and benefits costs include, and how the money splits between pay and benefits, using US government data.
- Why costs are rising into 2027, with health benefits growing more than twice as fast as salary budgets.
- Eight steps to manage the spend, from a cost baseline to a quarterly review.
- The cost levers that hurt retention least, and the role hiring plays in total cost.
- The pay laws that now shape budgets, and the metrics to report to finance.
 ChatGPT
 Gemini
 Claude
 Grok
 Perplexity
What are compensation and benefits costs?
Compensation and benefits costs are the total amount an employer spends on its people: direct pay such as wages, salaries, overtime and bonuses, and indirect pay such as insurance, paid leave, retirement contributions and legally required taxes. Together they form the total cost of employing each person, which is always higher than the salary on the offer letter.
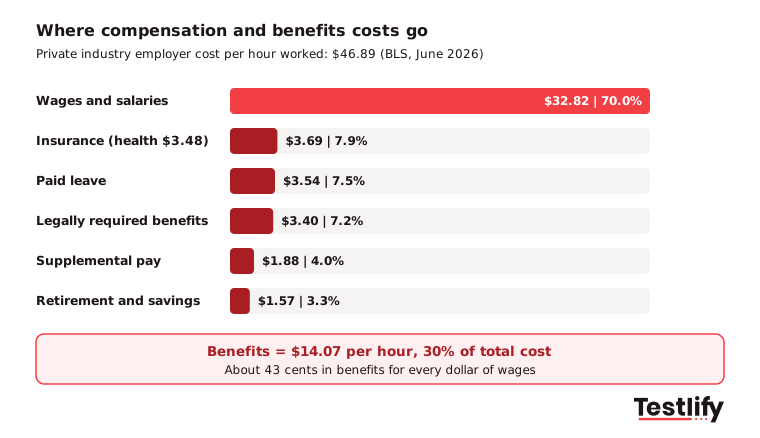
The US Bureau of Labor Statistics tracks this split every quarter. In June 2026, private employers spent an average of $46.89 per hour worked on each employee.
Wages and salaries were $32.82 of that (70.0%), and benefits were $14.07 (30.0%).
Cost component | What it includes | Cost per hour worked | Share of total |
|---|---|---|---|
Wages and salaries | Base pay for time worked | $32.82 | 70.0% |
Insurance | Health, life and disability cover (health alone is $3.48) | $3.69 | 7.9% |
Paid leave | Vacation, holidays, sick and personal leave | $3.54 | 7.5% |
Legally required benefits | Social Security, Medicare, unemployment insurance, workers' compensation | $3.40 | 7.2% |
Supplemental pay | Overtime, shift pay and nonproduction bonuses | $1.88 | 4.0% |
Retirement and savings | 401(k) matches and pension plans | $1.57 | 3.3% |
Source: BLS Employer Costs for Employee Compensation, private industry, June 2026, table 1.
A simple way to read the table: for every dollar of wages, the average private employer spends about 43 cents more on benefits (our calculation from the BLS figures). An $80,000 salary carries roughly $34,000 in extra cost before anyone is hired.
For the full list of pay and benefit types, see the different types of compensation and benefits.

Why are compensation and benefits costs rising?
Compensation and benefits costs are rising mainly because health benefits are growing far faster than pay. Employers project health cost per employee to rise 8.2% in 2027, while salary increase budgets sit around 3.4% to 3.5%.
That gap squeezes every other part of the total rewards budget.
The numbers from the last 12 months:
- Health benefits. The Mercer survey of more than 1,800 US employers, released in September 2026, projects health benefit cost per employee to rise 8.2% in 2027 even after planned cost cuts, the highest increase since 2003. With no changes, employers expect 11%. Growing use of GLP-1 drugs for weight management accounts for about one percentage point of the rise.
- Premiums. The KFF 2025 Employer Health Benefits Survey put the average family premium at $26,993 a year, up 6%, with workers paying about 26% of it. Single cover averaged $9,325, up 5%.
- Pay budgets. WTW data reported by SHRM in August 2026 shows US salary increase budgets of 3.5% for 2026 and a projected 3.4% for 2027, with more money going to targeted, merit-based raises.
- Pressure on HR. In the Payscale 2026 Compensation Best Practices Report, 51% of organizations named balancing pay expectations with financial limits as their top challenge, and only 61% have a compensation strategy at all.
The result is a budget where benefits quietly take a larger share each year unless someone manages them on purpose. Mercer found that 59% of employers plan cost-cutting changes to health benefits for 2027, and about two-thirds of large employers expect to raise the share of premiums employees pay.
How do you manage compensation and benefits costs?
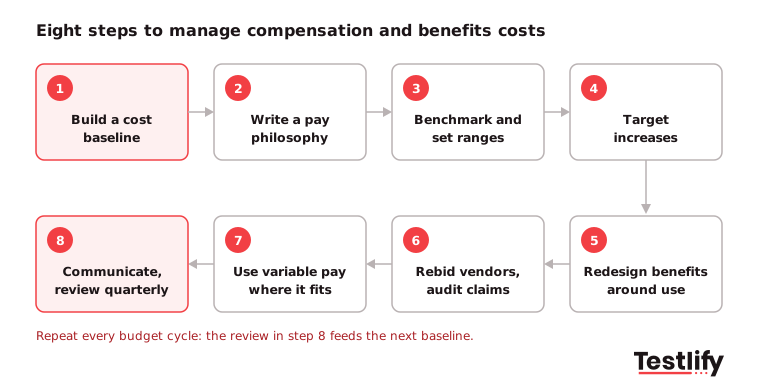
Managing compensation and benefits costs starts with a full cost baseline, then a clear pay philosophy, market-based ranges, benefits redesigned around real use, competitive vendor pricing, variable pay where it fits, clear communication and a quarterly review. The aim is to spend each dollar where it keeps or attracts people, not to cut blindly.
1. Build a total cost baseline
Pull payroll, bonus, benefits invoices, employer taxes and leave data into one view per employee, team and location. Most teams find costs they did not know they owned, such as unused plan tiers or bonuses paid outside policy.
2. Write down your compensation philosophy
Decide where you want to pay against the market and what you reward. For example, pay at the median for most roles and above it for critical ones. A written philosophy stops one-off exceptions from setting the real budget.
3. Benchmark and set pay ranges
Compare roles with current salary survey data and build ranges for every job family. Ranges make offers faster and keep internal pay fair. They are also now required in job ads in many places.
4. Target increases instead of spreading them
With budgets near 3.4%, an even raise for everyone satisfies no one. Fund promotions, critical skills and people below range first, as many employers are now doing.
5. Redesign benefits around real use
Use claims and enrollment data to see which benefits people use and value. Review plan design, pharmacy rules, including your GLP-1 policy, and wellness programs that nobody joins. Flexible stipends or lifestyle spending accounts often cost less than a fixed perk few people use.
6. Shop vendors and fund smartly
Ask your broker to rebid medical, dental and pharmacy contracts on a regular cycle. Audit claims and fees, and check whether a different funding model or stop-loss setup fits your size.
7. Use variable pay where it fits
Bonuses, commissions and spot awards tied to clear goals reward results without raising fixed costs that compound every year.
8. Communicate and review every quarter
Show people their total rewards and explain any cost shift before open enrollment. Track the metrics listed later in this guide so finance sees the trend early.
Pro tip: Run the total cost baseline before budget season, not during it. Teams that bring a per-employee cost view to the budget meeting negotiate trade-offs; teams that bring only a payroll number get handed a cut.
Which cost levers save money without hurting retention?
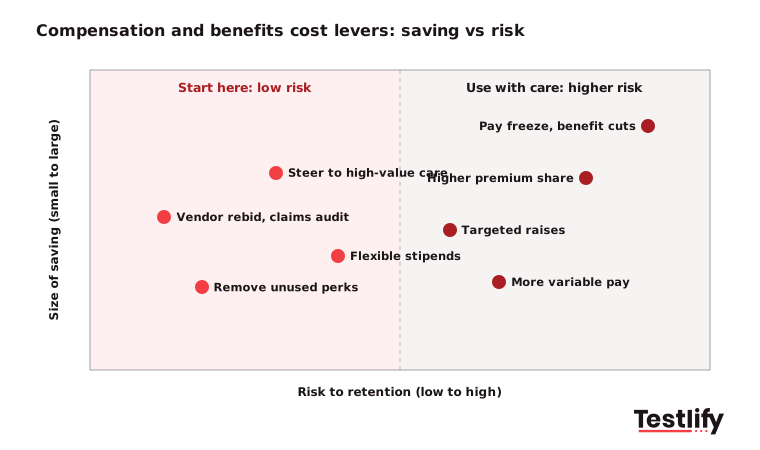
Cost levers that save money without hurting retention are the ones employees barely notice: better vendor pricing, claims audits, removing benefits nobody uses, and steering people to higher-value care. Levers that move cost onto employees, such as higher deductibles or frozen pay, save faster but carry real risk of turnover.
Lever | Where the saving comes from | Risk to retention | Best used when |
|---|---|---|---|
Vendor rebid and claims audit | Lower fees, fixed billing errors | Low | Contracts are 3+ years old |
Remove unused benefits and perks | Cuts spend with no real loss | Low | Usage data shows low enrollment |
Steer to high-value care | Fewer costly claims over time | Low | You have a large enough plan to shape |
Flexible stipends instead of fixed perks | Pay only for what people pick | Low to medium | The workforce has mixed needs |
Targeted raises instead of across the board | Money goes to critical roles | Medium | Budget is tight and roles differ |
More variable pay | Lower fixed cost growth | Medium | Goals are clear and measurable |
Higher employee premium share or deductibles | Moves cost to employees | High | Other levers are used up |
Pay freezes or benefit cuts | Fast, large saving | High | Short-term survival only |
Across the teams we talk to, the expensive mistake is starting at the bottom of this table. A cut to health cover or a pay freeze saves money this year and then shows up as regretted turnover, which costs far more to replace.
For more on that trade-off, see common mistakes to avoid while offering compensation and benefits.
How does hiring affect compensation and benefits costs?
Hiring affects compensation and benefits costs because every hire locks in a salary plus roughly 30% more in benefits for as long as the person stays. A wrong hire means paying that full cost for months, then paying again to recruit, onboard and train a replacement.
Three hiring habits drive compensation and benefits spend up:
- Hiring on resumes instead of skills. Paying for titles and years of experience often means paying a premium for skills the role does not need, or missing skills it does. Payscale found that 61% of organizations added AI skills to existing roles, but 55% have not adjusted pay for them, so pay and real skills drift apart.
- Not measuring quality of hire. SHRM's 2025 benchmarking data puts the average cost per hire at $5,475 for nonexecutive roles and $35,879 for executives, yet only 20% of organizations track quality of hire. Without it, a costly mis-hire looks the same as a good one in the budget.
- Slow hiring. Long open roles push teams into overtime, contractors and rushed counteroffers, all of which inflate compensation costs.
We have seen hiring teams cut this waste by checking skills before the interview stage and making pay decisions on evidence. Testlify supports that with 3,500+ role-specific tests and structured AI interviews that score every candidate the same way, so the offer goes to the person who can actually do the job.
To estimate the cost side, try the quality of hire calculator or read the real cost of a bad hire.
What laws affect compensation and benefits costs?
Pay transparency, equal pay and benefits rules all affect compensation and benefits costs, because they force employers to publish ranges, justify pay gaps and fix them. Fixing a gap after an audit almost always costs more than building fair ranges first.
US pay transparency
As of August 1, 2026, 16 states plus the District of Columbia have salary range disclosure laws, according to a National Law Review update. Covered states include California, Colorado, Illinois, Massachusetts, New Jersey, New York, Virginia and Washington. Delaware follows in September 2027.
EU Pay Transparency Directive
The deadline to turn the directive into national law was 7 June 2026, and most member states missed it. Employers must still prepare. They should share the pay range before interviews and stop asking about salary history.
Employers with 250+ workers must report gender pay gaps from 2027. A gap of 5% or more that is not justified or fixed within six months triggers a joint pay assessment, as Mayer Brown explains.
Laws differ by state and country, so check the statute or employment counsel before you change ranges or plans. For the US basics, see how to stay compliant with compensation and benefits laws and what pay transparency means for employers.
Which metrics show compensation and benefits costs are under control?
Compensation and benefits costs are under control when total cost per employee, benefits as a share of payroll and health cost trend move in line with your plan, and pay fairness and retention hold steady at the same time. Track a short set of metrics every quarter and share them with finance.
Metric | How to calculate it | What it tells you |
|---|---|---|
Total compensation cost per FTE | All pay and benefits costs / full-time equivalents | The real cost of each role, beyond salary |
Benefits as % of payroll | Benefits costs / total wages and salaries | Whether benefits are taking a larger share each year |
Health cost trend | Change in health cost per employee year over year | How you compare with the 8.2% market projection |
Compa-ratio | Employee pay/midpoint of the pay range | Who is underpaid (flight risk) or overpaid |
Benefit utilization rate | Employees using a benefit/employees eligible | Which benefits earn their cost |
Pay gap by group | Average pay difference within the same job level | Legal and fairness risk before an audit |
Regretted turnover | Leavers you wanted to keep / average headcount | Whether cost cuts are pushing good people out |
Cost per hire and quality of hire | Recruiting spend / hires, plus new-hire performance | Whether hiring adds cost or value |
Tools help here. A compensation platform or HRIS that joins pay, benefits and performance data saves weeks of spreadsheet work; see the top compensation management tools for options.
Every hire locks in pay and benefits costs for years, so each offer should rest on evidence of skill, not a resume alone. Testlify helps you check skills before the interview stage with 3,500+ validated tests.
To get started, browse the Testlify test library to pick the right tests for your open roles or book a demo to see how Testlify can fit into your hiring process.
Frequently asked questions (FAQs)

Human Resources Lead
Snehi Parmar leads People at Testlify, owning hiring, culture, performance, and retention for a 90-person team. She writes on practical HR strategy and building people processes that scale.
Related resources
View all
HR & recruitment
How to choose the right compensation and benefits for your organization?

HR & recruitment
What are the different types of compensation and benefits?

HR & recruitment
What are the steps in workforce planning? A 7-step guide for HR teams

HR & recruitment
Importance of workforce planning

HR & recruitment
How to create a competitive compensation & benefits package?

HR & recruitment
Importance of compensation and benefits
Get started.
Hire on proof, not resumes.
Run your first skills-based assessment free — no credit card required.