
Data analytics in recruitment: a practical guide for 2026
How hiring teams use data to cut time to hire and lift quality of hire: the metrics to track, five steps to start, and how to stay fair.

Data analytics in recruitment is the practice of collecting hiring data from your ATS, assessments, interviews and HR systems, then using it to see what slows hiring down, what each hire costs and which candidates go on to succeed. It replaces gut feel with evidence at every stage, from sourcing to the first year on the job.
TL;DR:
- Data analytics in recruitment means combining ATS, assessment, interview and HRIS data to see what slows hiring, what hires cost and who succeeds.
- It matters because 69% of organizations still struggle to fill full-time roles, according to SHRM's 2025 Talent Trends report.
- Start with two metrics, such as time to hire and source of hire, and review them weekly for 60 days. Add quality of hire once 90-day ratings exist.
- Link assessment scores to 90-day reviews and 12-month retention to improve quality of hire. LinkedIn found only 25% of TA pros feel highly confident measuring it.
- To cut time to hire, rank stages by median days and fix the slowest one first. Delays often sit in offer approvals, not sourcing.
- Calculate ROI as savings from faster hiring plus lower attrition, divided by program cost. Record a baseline first or you cannot prove improvement.
- Use a low score as a flag for closer review, not a hard cut-off. Check outcomes by group for adverse impact, and keep a person accountable for each decision.
 ChatGPT
 Gemini
 Claude
 Grok
 Perplexity
What is data analytics in recruitment?
Data analytics in recruitment is the use of hiring data to measure, explain and improve how a company finds, assesses and hires people. Teams pull data from each stage of the funnel, turn it into a small set of metrics, and use those metrics to decide where to act, such as which channel to fund or which stage to fix.
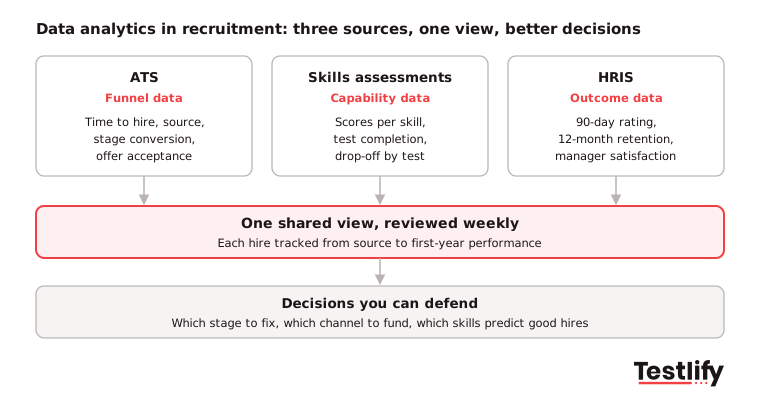
Most companies already have plenty of hiring data. It sits in three to five systems: an ATS, a sourcing tool, a skills assessment platform, an interview tool and an HRIS. Data analytics in recruitment connects those systems so one question can be answered end to end, for example "do the candidates who score well on our sales test still perform well after a year?"
You will also see the term recruitment analytics used for the same practice. Whatever the label, the goal is the same: hiring decisions you can explain with evidence.

Why does data analytics in recruitment matter in 2026?
Data analytics in recruitment matters because hiring is still hard and budgets are watched closely. When teams can see where time and money go, they fix the right problem first instead of adding more sourcing or more interviews by habit.
The pressure is real. SHRM's 2025 Talent Trends report found that 69% of organizations still struggle to fill full-time roles, and that AI use in HR tasks rose to 43% in 2025 from 26% in 2024. More tools mean more data, but only if someone connects it to decisions.
The main benefits for hiring teams are:
- Faster hiring: Stage-level data shows exactly where candidates wait, so the team removes the delay instead of guessing.
- Lower cost per hire: Channel data shows which sources bring hires who stay, so spend moves away from channels that only bring volume.
- Better quality of hire: Linking assessment scores to performance shows which skills really predict success in a role.
- Fairer decisions: The same criteria and data for every candidate make bias easier to spot and harder to hide.
- A seat at the table: Talent leaders can show the business what hiring delivers in numbers the CFO already uses.
"The hiring teams that close roles faster and retain more of the talent they hire are not the best-funded. They are the most deliberate about what they measure and what they do with that data." Abhishek Shah, Founder and CEO, Testlify
What are the four types of data analytics in recruitment?
Data analytics in recruitment comes in four types: descriptive, diagnostic, predictive and prescriptive. Each answers a harder question than the one before, and each needs more connected data. Most teams start with descriptive reports from their ATS and move up as their data improves.
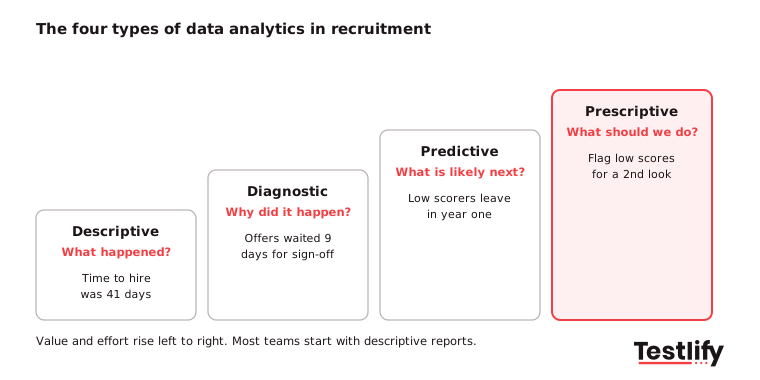
Type | Question it answers | Recruiting example | Data needed |
|---|---|---|---|
Descriptive | What happened? | Time to hire was 41 days last quarter | ATS reports |
Diagnostic | Why did it happen? | Offers waited 9 days for sign-off | ATS stage timestamps, approval logs |
Predictive | What is likely to happen? | Candidates below a test score leave more often in year one | Assessment scores plus HRIS outcomes |
Prescriptive | What should we do? | Send low scorers to a second review instead of auto-rejecting | All of the above, plus agreed rules |
The examples are illustrations, not benchmarks. Predictive work also has a minimum data need: you need enough hires in one role family, with ratings at 90 days and retention at 12 months, before patterns mean anything. See how teams apply this in predictive hiring.
Which recruiting metrics should you track?
Recruiting metrics worth tracking are the ones tied to your biggest current problem: speed, cost or quality. Start with two, review them weekly, and add more once the habit sticks. The table gives each metric's formula and the decision it should drive.
Metric | Formula | What it tells you | Decision it drives |
|---|---|---|---|
Time to hire | Date offer accepted minus date candidate applied | How fast you move a candidate | Which stage to speed up |
Time to fill | Date offer accepted minus date role opened | How long a seat stays empty | When to open roles earlier |
Cost per hire | (Internal + external recruiting costs) / hires | Spend per hire | Where to cut or move budget |
Source of hire | Hires from a channel / total hires | Which channels produce hires | Which channels to fund |
Stage conversion rate | Candidates moving on / candidates in the stage | Where candidates drop or get stuck | Which stage to redesign |
Offer acceptance rate | Offers accepted / offers made x 100 | How strong your offer and process are | Pay, speed or messaging fixes |
Interview-to-offer ratio | Interviews held / offers made | How well screening filters | Tighten earlier screening |
Quality of hire | Average of performance rating, 12-month retention and manager satisfaction scores | Whether hires succeed | Which criteria to keep |
First-year attrition | Hires who left within 12 months / hires x 100 | Early mismatch | Fix role fit or onboarding |
Candidate NPS | % promoters minus % detractors | How candidates feel about the process | Fix the candidate experience |
See the glossary entries for time to hire and cost per hire for worked examples, and this guide to choosing your recruitment KPIs for setting targets.
Pro tip: Pick two metrics and review them every week for 60 days before adding more. Time to hire and source of hire are the easiest starting pair because any ATS can export them. Add quality of hire once a 90-day performance rating exists for new hires.
How do you use data analytics to improve recruitment?
Using data analytics to improve recruitment comes down to five steps: set clear metrics and a baseline, connect your tools, analyze candidate data, fix the weakest stage, and keep the data use ethical. Repeat the cycle every quarter, and review the numbers weekly in between.
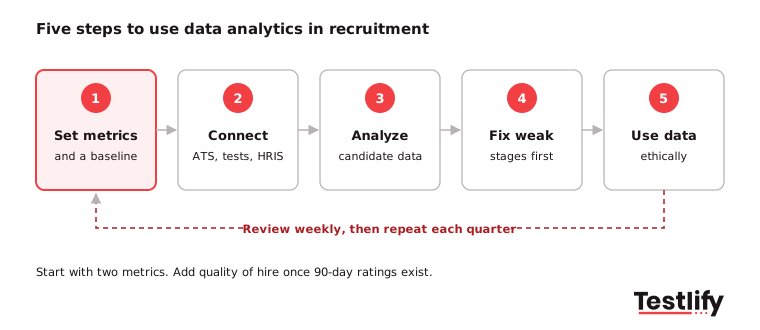
- Set clear metrics and a baseline: Choose metrics that match your goals. A company that values speed weights time to hire; one fighting early turnover weights quality of hire and first-year attrition. Record today's numbers before changing anything, or you will never prove improvement.
- Connect your tools: Make sure your ATS, assessment platform and HRIS can share data, by integration or by a simple weekly export into one sheet. Choose tools that fit your size: a growing team can live inside ATS reports, while an enterprise team may add a BI dashboard.
- Analyze candidate data for better selection: Look at applications, structured interviews and skills assessment results side by side. Ask which skills and scores show up in your best performers in the same role, and check that those patterns hold across groups, not just on average.
- Fix the weakest stage first: Find the stage where candidates drop out or wait longest. If many quit during a long application form, shorten it. If some job ads bring more qualified applicants, find out why and reuse what works. Our guide to candidate drop-off covers the common causes.
- Use data ethically: Tell candidates what you collect and why, get consent where the law asks for it, store data securely, and keep a person responsible for every decision. Ask candidates, recruiters and hiring managers for feedback too, and read it next to the numbers.
Key takeaway: The aim is not more dashboards. The aim is one decision each month that you made differently because of what the data showed.
How does data analytics improve quality of hire?
Data analytics improves quality of hire by linking what candidates show before they are hired to how they perform afterwards. When assessment scores, structured interview ratings, 90-day reviews and 12-month retention sit in one view, patterns appear that no single interviewer could see.
Talent teams know this matters but struggle to do it. LinkedIn's Future of Recruiting 2025 report found that 89% of TA professionals say measuring quality of hire will become more important, yet only 25% feel highly confident they can measure it. The same report found that 93% see accurate skills assessment as crucial to quality of hire, and that the most common measures are performance ratings (66%), new-hire retention (60%) and hiring manager satisfaction (44%).
The link is built in three layers:
- Layer 1, funnel data: Time to hire, source of hire and stage conversion from the ATS. Most teams already have this.
- Layer 2, assessment to shortlist: Which score ranges lead to offers. This needs the same pre-employment tests for everyone in a role.
- Layer 3, assessment to outcome: Which score profiles go on to perform and stay. Few teams reach this layer without a consistent assessment program.
Once there is enough data, teams usually find a score below which early attrition rises. The safe way to use that is as a flag for a closer look, not a hard cut-off, and to check that the threshold does not screen out one group more than another. For more ideas, see how to improve quality of hire.
How do you cut time to hire with recruitment data?
Cutting time to hire with recruitment data starts with finding the stage that eats the most days. Delays usually sit in three places: from application to first screen, between interview rounds, and from final interview to offer. Stage-level data shows which one is yours.
A simple exercise works for most teams. Pull last quarter's hires, calculate the median days spent in each stage, and rank the stages. Put your effort into the top one. The most common mistake is fixing the wrong stage, for example buying more sourcing when the real delay is internal approval of offers.
Common fixes by stage:
- Application to first screen: screen with a short skills test sent automatically on application, instead of waiting for a recruiter to read every resume.
- Between interviews: book panels in advance and set a 48-hour rule for feedback.
- Final interview to offer: pre-approve salary bands so offers do not wait for sign-off.
What should a recruitment data dashboard include?
A recruitment data dashboard should show the few numbers a team acts on each week, broken down by role, recruiter and source. Keep it to one screen. A dashboard nobody opens is worse than a weekly spreadsheet the team actually reads.
A useful dashboard includes:
- Open roles, time to fill so far, and roles at risk of missing their target date
- Time to hire and stage conversion rates, by stage
- Source of hire and cost per hire, by channel
- Offer acceptance rate and reasons for declined offers
- Assessment completion rate and score spread for each role
- Quality of hire and first-year attrition for last year's hires
- Candidate NPS or survey scores
Testlify's free calculators, such as the quality of hire calculator, help set first baselines before a dashboard exists.
How do you measure the ROI of data analytics in recruitment?
Measuring the ROI of data analytics in recruitment means comparing what the program saves or earns with what it costs. Most teams never calculate it because they skip the baseline. A simple formula works: ROI = (savings from faster hiring + savings from lower attrition) / cost of the analytics program.
- Record a baseline: Note cost per hire, time to hire, first-year attrition and offer acceptance rate before you start.
- Put a value on a day: For revenue roles, estimate the output lost each day a seat is empty. For other roles, use your own replacement cost.
- Count the savings: Multiply days saved by hires and daily value, then add the cost of early leavers you avoided.
- Count the cost: Include tools, integration work and the time of the person who owns the analysis.
- Look at three years: Quality-of-hire insights grow with every hiring cohort, so a one-year view undersells them.
Here is an illustration with assumed numbers; replace each with your own. A team makes 200 hires a year and values a vacant day at $400. Cutting 5 days from time to hire saves 200 x 5 x $400 = $400,000. Avoiding 10 early leavers at a $15,000 replacement cost saves $150,000 more. Against a $100,000 program cost, the return is 5.5 to 1.
What are the biggest challenges, and how do you fix them?
Data analytics in recruitment usually stalls for four reasons: data is spread across systems, nobody owns the analysis, the numbers are not tied to decisions, and the data itself is messy. Each has a practical fix that does not need a data science team.
- Data lives in too many places: Sourcing data sits in one tool, pipeline data in the ATS, scores in an assessment platform and performance in the HRIS. Do not replace them. Pull four numbers (time to hire, source, assessment score, first-year performance) into one shared view. A spreadsheet updated weekly beats a perfect data warehouse that is always next quarter.
- Nobody owns the analysis: Name one person, often a recruiting operations lead, to run the weekly review. That person does not need to be a data scientist; they need to ask why each number moved and send the answer to someone who can act.
- The numbers do not change decisions: Test it: can the team name one hiring decision made differently in the last 30 days because of the data? If not, fix the workflow before buying more tools.
- The data is messy: Missing stage dates and free-text reasons make reports unreliable. Make key fields required in the ATS and audit them every quarter.
How do you use candidate data ethically and legally?
Using candidate data ethically means collecting only what you need, telling candidates how it is used, keeping it secure and keeping people accountable for decisions. Laws on automated hiring tools now make this a legal duty in several places, not just good practice.
- Privacy law: Under GDPR in the EU and UK, and under state laws such as the CCPA in California, candidates have rights over their data. Explain what you collect, why, and how long you keep it.
- Automated decision tools: New York City's Local Law 144 requires a yearly bias audit, published results and candidate notice before employers use an automated tool to screen or score candidates.
- High-risk AI: The EU AI Act treats AI used to recruit or evaluate candidates as high-risk, with duties on oversight and record keeping.
- Health data: Collect health information only where the law requires it, and keep it out of hiring analytics.
Check outcomes by group as well. If one group passes a stage at a much lower rate than others, look at the adverse impact and fix the cause before scaling the process.
How does Testlify support data-driven hiring?
Testlify gives hiring teams the skills data that makes the predictive layer of hiring analytics possible, alongside the reporting to act on it. Candidates take role-based assessments built from 3,500+ tests and 25+ question types, and every result arrives scored and comparable.
- Reporting built in: Per-skill score breakdowns, AI-written strengths and gaps, question analytics, benchmarking, weighted scoring and a drop-off report across multi-stage assessments. Exports go to CSV or PDF. See reporting and analytics.
- Data where you need it: Two-way sync with 100+ ATS and HRIS tools, including Workday, Greenhouse, Lever and SAP SuccessFactors, so scores sit next to the rest of your hiring data. See integrations.
- Results you can trust: 20+ proctoring checks keep scores honest, and Testlify's matching model completed a third-party bias audit under Local Law 144 on June 16, 2023. See the NYC bias audit.
Testlify reports 55% faster time to hire for teams that hire with its assessments.
Ready to put your hiring data to work?
Start with the data that predicts performance. Try Testlify free for 7 days, no credit card required, build a skills assessment from your own job description, and see how the reports fit your hiring metrics. Or book a demo to see the analytics on a real role.
Frequently asked questions (FAQs)
Related resources
View all
HR & recruitment
Case studies of companies that successfully used skill assessments

HR & recruitment
Importance of attention to detail in the workplace

HR & recruitment
Top 7 recruitment trends in system analyst hiring

HR & recruitment
Case studies of how recruiters have used coding aptitude tests to hire top talent

HR & recruitment
Top 6 job search sites

HR & recruitment
AI in employee monitoring: how it works and what’s legal
Get started.
Hire on proof, not resumes.
Run your first skills-based assessment free — no credit card required.