
21 recruitment metrics to track in 2026, with formulas
21 recruitment metrics for speed, funnel, cost, quality and candidate experience, each with a formula, an example and when to use it.

Recruitment metrics are the numbers a hiring team uses to see how fast, how well, and at what cost it fills open roles. They turn a hiring process that runs on gut feel into one you can check, compare, and fix, stage by stage, from the first application to a new hire's first year.
 ChatGPT
 Gemini
 Claude
 Grok
 Perplexity
TL;DR
- Recruitment metrics measure the speed, cost, quality, and fairness of hiring. The 21 below fall into five groups: speed, funnel, cost, quality, and candidate experience.
- Start with six: time to hire, stage yield ratios, offer acceptance rate, cost per hire, quality of hire, and first-year attrition.
- Quality of hire matters most and is measured least. LinkedIn found 89% of TA pros expect it to grow in importance, but only 25% feel highly confident measuring it.
- SHRM's 2026 benchmarking puts the median time to fill at 39 calendar days for nonexecutive roles.
- Recruiting funnel metrics show where candidates drop out, so you fix one stage instead of the whole process.
- Track adverse impact at every stage. A group selected at under 80% of the top group's rate is a warning sign under the four-fifths rule.
- Review speed and funnel metrics weekly, cost and quality monthly or quarterly, and always by role family.

What are recruitment metrics?
Recruitment metrics are measurements that show how well your hiring process works, such as time to hire, cost per hire, offer acceptance rate, and quality of hire. Each one answers a specific question about speed, cost, candidate flow, or the people you hire, using data most teams already hold in their applicant tracking system.
People often use recruiting metrics and recruitment KPIs as if they meant the same thing. A metric is any number you track. A KPI is a metric you have chosen as a goal, with a target and an owner. Time to hire is a metric. "Cut time to hire for support roles from 30 to 21 days by Q3" is a KPI. Testlify's guide to recruitment KPIs covers how to set those targets.
Why do recruitment metrics matter?
Recruitment metrics matter because they show where hiring is slow, expensive, or inaccurate before the business feels it as missed targets or early leavers. Without them, teams argue from anecdotes. With them, a TA leader can show a CFO what a vacancy costs and a hiring manager why a role is stuck.
They also change what gets fixed. A team that only tracks time to fill will push for speed and may hire worse. A team that pairs speed with quality and attrition sees the trade-off and can decide on purpose.
The pressure to measure is rising. LinkedIn's Future of Recruiting 2025 found that 89% of talent acquisition professionals say measuring quality of hire will become more important, yet only 25% feel highly confident in their ability to measure it.
Which recruitment metrics should you track?
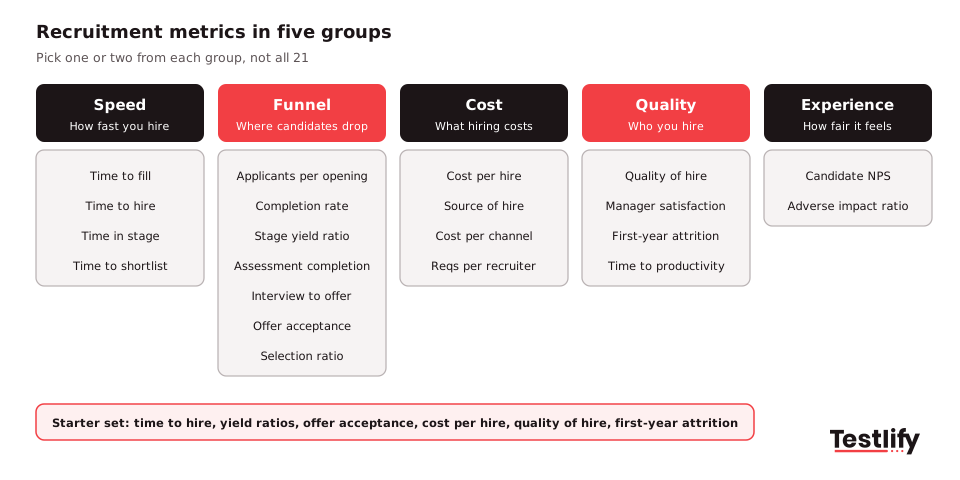
The key recruitment metrics fall into five groups: speed, funnel, cost, quality, and candidate experience. Most teams need one or two from each group, not all 21. The table lists every metric in this guide with its formula, so you can pick the ones that answer your team's real questions.
# | Metric | Group | Formula | What it tells you |
|---|---|---|---|---|
1 | Time to fill | Speed | Offer accepted date minus requisition approved date | How long a seat stays empty |
2 | Time to hire | Speed | Offer accepted date minus date the candidate entered the pipeline | How fast you move a candidate |
3 | Time in stage | Speed | Total days in a stage / candidates who passed through it | Where candidates wait |
4 | Time to shortlist | Speed | Date of first shortlist sent to the hiring manager minus job open date | How fast screening delivers |
5 | Applicants per opening | Funnel | Applications / open roles | Reach of your job posts |
6 | Application completion rate | Funnel | Completed applications / started applications x 100 | Friction in your application form |
7 | Stage yield ratio | Funnel | Candidates who pass a stage / candidates who entered it x 100 | Which stage filters too much or too little |
8 | Assessment completion rate | Funnel | Completed assessments / invited candidates x 100 | Whether your test is fair in length and clear |
9 | Interview to offer ratio | Funnel | Interviews / offers | Shortlist accuracy |
10 | Offer acceptance rate | Funnel | Offers accepted / offers made x 100 | How competitive your offer and process are |
11 | Selection ratio | Funnel | Hires / applicants x 100 | How selective the role is |
12 | Cost per hire | Cost | (Internal costs + external costs) / hires | What each hire costs |
13 | Source of hire | Cost | Hires from a source / total hires x 100 | Which channels produce hires |
14 | Cost per hire by channel | Cost | Spend on a channel / hires from that channel | Which channels are worth the money |
15 | Requisitions per recruiter | Cost | Open requisitions / recruiters | Recruiter workload |
16 | Quality of hire | Quality | Average of performance, retention and manager scores | Whether you hire people who succeed |
17 | Hiring manager satisfaction | Quality | Average survey score from hiring managers | Whether the business trusts TA |
18 | First-year attrition | Quality | New hires who left within 12 months / new hires x 100 | Mis-hires and onboarding gaps |
19 | Time to productivity | Quality | Date a new hire meets agreed output minus start date | How ready new hires are |
20 | Candidate net promoter score | Experience | % promoters (9 to 10) minus % detractors (0 to 6) | How candidates feel about your process |
21 | Adverse impact ratio | Experience | Selection rate of a group / selection rate of the highest group | Whether a stage screens out a group unfairly |
What are the speed metrics?
Speed metrics measure how long hiring takes, from the day a role opens to the day a candidate says yes. They matter because empty seats cost output and slow processes lose the best candidates first, since strong people often hold several offers at once.
1. Time to fill
Time to fill counts the days from requisition approval to offer acceptance. It is the number finance and hiring managers care about, because it is how long the seat stays empty. SHRM's 2026 recruiting benchmarking, based on data from over 4,600 organizations, reports a median time to fill of 39 calendar days for nonexecutive positions. Read more in the time to fill glossary entry.
2. Time to hire
Time to hire counts the days from when a candidate enters your pipeline (applies or is sourced) to when they accept. It measures your process, not the market. If the time to fill is 45 days but time to hire is 18, the role sat unadvertised or empty of good applicants for most of that time. See the time to hire glossary entry for more detail.
3. Time in stage
Time in stage is the average number of days candidates spend in each step: screening, assessment, first interview, panel, and offer. It is the most useful speed metric for fixing delays, because it points to the exact step where candidates wait. A panel stage that averages 11 days usually means calendars, not candidates, are the problem.
4. Time to shortlist
Time to shortlist counts the days from opening a role to sending the hiring manager the first set of qualified candidates. Hiring managers judge recruiting by this number more than any other. Skills tests at the top of the funnel shorten it, because recruiters rank on results instead of reading every resume.
Pro tip: Report time to fill and time to hire side by side. The gap between them shows how much delay comes from sourcing and approvals rather than from your interview process.
What are the recruiting funnel metrics?
Recruiting funnel metrics track how many candidates move from one stage to the next, from application to accepted offer. They show where good candidates drop out and where a stage lets too many weak ones through, so you can fix a single step instead of redesigning the whole process.
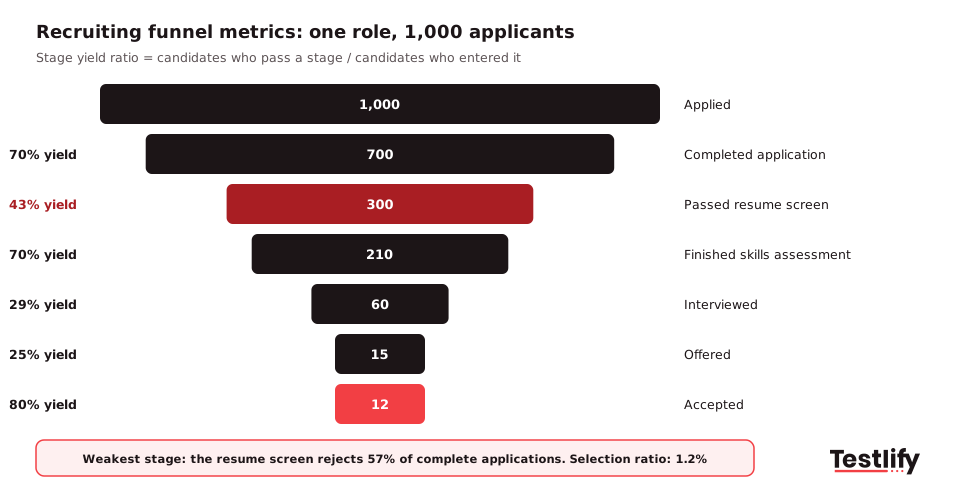
Here is a worked example for one high-volume support role. Of 1,000 applicants, 700 complete the application (70%). 300 pass the resume screen (43%). 210 finish the skills assessment (70%). 60 reach an interview (29%). 15 get an offer (25%), and 12 accept (80%). The weak spot is the resume screen, which rejects 57% of complete applications on paper alone.
5. Applicants per opening
Applicants per opening divides total applications by open roles. A very high number can mean a job ad that is too broad. A very low number points to a narrow ad, a weak employer brand, or a pay range below market.
6. Application completion rate
Application completion rate is completed applications divided by started ones. If 1,000 people start and 700 finish, the rate is 70%. Long forms, forced account creation, and asking for the same data twice are the usual causes of a low rate.
7. Stage yield ratio
Stage yield ratio is the share of candidates who pass each stage. It is the core of every recruiting funnel, and Testlify's glossary explains yield ratios in more depth. Compare each stage with the one after it: if 80% of interviewed candidates are rejected, the shortlist before the interview is not doing its job.
8. Assessment completion rate
Assessment completion rate is completed assessments divided by candidates invited. Most metric lists skip it, but it tells you whether your test is the right length and clearly explained. A low or falling rate usually means the test is too long for the role level or the invite does not say why it matters.
9. Interview to offer ratio
Interview to offer ratio is the number of interviews held for each offer made. Four interviews for one offer is efficient. Twelve means hiring managers are seeing candidates who should have been screened out earlier, which costs the most expensive hours in the process.
10. Offer acceptance rate
Offer acceptance rate is offers accepted divided by offers made, times 100. In the example above, 12 of 15 offers were accepted, so the rate is 80%. A falling rate points to pay, a slow process, or a poor interview experience, and exit questions to candidates who decline will tell you which.
11. Selection ratio
Selection ratio is hires divided by applicants. In the example, 12 hires from 1,000 applicants gives 1.2%. A very low ratio is not a badge of honor. It often means the team spends time on hundreds of people it was never going to hire.
What are the cost metrics?
Cost metrics show what you spend to fill roles and which channels earn their budget. They let TA leaders defend spend, move money from weak channels to strong ones, and show the effect of tools that remove manual screening hours from recruiters' weeks.
12. Cost per hire
Cost per hire adds internal costs (recruiter time, tools, referral bonuses) and external costs (job ads, agencies, events) and divides by hires in the same period. If a team spends $40,000 internally and $56,000 externally to make 20 hires, cost per hire is $4,800. The cost per hire glossary entry lists what to include.
13. Source of hire
Source of hire is the share of hires that came from each channel: job boards, referrals, careers site, sourcing, agencies, internal moves. Track hires, not applicants, because the channel that sends the most applications is often not the one that sends the most hires.
14. Cost per hire by channel
Cost per hire by channel divides spend on one channel by the hires it produced. A job board that costs $6,000 a quarter and yields three hires costs $2,000 per hire. Pair it with quality of hire by channel, so you do not cut a pricier channel that brings people who stay.
15. Requisitions per recruiter
Requisitions per recruiter is open roles divided by recruiters. It explains many other numbers: when one recruiter carries 40 roles, time to hire and candidate experience both suffer. Use it when you ask for headcount or tools.
Key takeaway: Cost per hire alone rewards cheap hiring. Read it next to quality of hire and first-year attrition, because a cheap hire who leaves in four months is the most expensive hire you make.
What are the quality of hire metrics?
Quality of hire metrics show whether the people you hire perform, stay and fit the role. They are the reason the other recruitment metrics exist: a fast, cheap process that hires the wrong people has failed. They take longer to measure, so start collecting the data now.
16. Quality of hire
Quality of hire has no single formula. Most teams average a few scores on the same scale. LinkedIn's 2025 research found TA teams most often use job performance ratings (66%), new hire retention (60%) and hiring manager satisfaction (44%). A simple version: performance rating at 6 months (out of 5, scaled to 100), plus retention at 12 months (100 or 0), plus manager score (scaled to 100), divided by three. Testlify's guide on how to improve quality of hire covers what moves it.
17. Hiring manager satisfaction
Hiring manager satisfaction is the average score from a short survey sent after each hire, and again at 90 days. Ask two things: how well did the shortlist match the role, and would you hire this person again? Low scores with good speed numbers mean recruiters are fast but not aligned with the role.
18. First-year attrition
First-year attrition is the share of new hires who leave within 12 months. If 50 people join and 8 leave in their first year, the rate is 16%. Split it into people who quit and people you let go: quits point to the job preview and onboarding, dismissals point to selection.
19. Time to productivity
Time to productivity counts the days from start date to the point a new hire reaches an agreed output, such as a full ticket queue for support or a first merged release for an engineer. Agree the definition with each hiring manager before the hire starts, or the number means nothing.
What are the candidate experience and fairness metrics?
Candidate experience and fairness metrics show how candidates see your process and whether every stage treats groups fairly. They protect your employer brand and your legal position, and they often explain problems in the funnel, such as low completion or acceptance rates.
20. Candidate net promoter score
Candidate net promoter score asks candidates, hired or not, how likely they are to recommend applying to your company, on a 0 to 10 scale. Subtract the percentage of detractors (0 to 6) from the percentage of promoters (9 to 10). Send it right after a decision, while the experience is fresh. Testlify's glossary covers candidate experience in more detail.
21. Adverse impact ratio
Adverse impact ratio compares the selection rate of each group with the rate of the group selected most often, at each stage. Under the US four-fifths rule in the Uniform Guidelines on Employee Selection Procedures, a group selected at less than 80% of the highest group's rate is generally treated as evidence of adverse impact. If 40% of one group pass a screen and 28% of another, the ratio is 70%, and that stage needs a review.
Which recruitment metrics should you start with?
The recruitment metrics to start with depend on your hiring situation. A team that measures nothing today should begin with six: time to hire, stage yield ratios, offer acceptance rate, cost per hire, quality of hire and first-year attrition. Add more only when one of these raises a question you cannot answer.
Your situation | Start with | Why |
|---|---|---|
Just starting to measure | Time to hire, offer acceptance rate, cost per hire, first-year attrition | All four come straight from your ATS and payroll data |
High-volume hiring (support, sales, BPO) | Stage yield ratio, assessment completion rate, time in stage, adverse impact ratio | Small leaks at each stage add up across thousands of applicants |
Specialist or senior roles | Time to shortlist, interview to offer ratio, quality of hire, hiring manager satisfaction | Few candidates, so accuracy matters more than volume |
Budget review | Cost per hire, cost per hire by channel, source of hire, requisitions per recruiter | Shows where money and recruiter hours go |
Typical ranges vary a lot by role, region and channel. When you want to compare your numbers with the market, use Testlify's recruiting metrics benchmarks report, and compare like with like: one role family, one region, one period.
How do you optimize recruitment metrics?
You optimize recruitment metrics by fixing the stage behind the number, not the number itself. Find the metric that is furthest off, trace it to one stage of the funnel, change one thing in that stage, and measure again after a full hiring cycle before you change anything else.
- Slow time to hire: Check time in stage first. Most delay sits in scheduling and feedback, so set a 48-hour feedback rule for interviewers and book panel slots when the role opens.
- Low application completion rate: Cut the form to the questions you use to decide. Let candidates apply with a resume or profile and collect the rest later.
- Weak shortlists and a high interview to offer ratio: Replace resume screening with a short, role-specific skills test, so interviews go to candidates who have shown the skill. LinkedIn's research found 93% of TA pros see accurate skills assessment as crucial to quality of hire.
- Falling offer acceptance rate: Ask every candidate who declines why. Share the pay range early and keep the time from final interview to offer under a week.
- High first-year attrition: Give candidates a realistic job preview, such as a work sample or simulation, and check the 90-day survey for onboarding gaps.
- Adverse impact at one stage: Review the criteria at that stage, use structured questions and scoring, and remove steps that do not test a job-related skill.
The same approach works for any team: change one stage, wait a full hiring cycle, then compare the numbers.
What mistakes should you avoid with recruitment metrics?
The most common mistakes with recruitment metrics are tracking too many, reading one number on its own and mixing very different roles into one average. Each of these makes the data look precise while hiding the real problem.
- Tracking everything: A dashboard with 25 numbers gets ignored. Pick six to eight, each with an owner.
- Reading metrics alone: Faster time to hire with rising first-year attrition is not progress. Always pair a speed or cost metric with a quality metric.
- Blended averages: Time to fill for engineers and for contact center agents should never share one average. Split by role family and region.
- Unclear start dates: Decide whether time to hire starts at application or at first contact, write it down, and keep it the same every quarter.
- No baseline: Record three months of data before you change the process, or you cannot prove the change worked.
How can Testlify help you track recruitment metrics?
Testlify helps hiring teams improve the funnel and quality metrics that matter most by adding skills data to every stage. Recruiters build a role-specific assessment from a job description, invite candidates and get a ranked shortlist based on results, which shortens time to shortlist and lowers the interview to offer ratio.
Testlify's reporting and analytics include assessment-level and global benchmarking, question analytics, a multi-assessment drop-off report for assessment completion, and CSV or PDF export, so your scores sit next to the rest of your recruitment metrics. Results sync to 100+ ATS and HRIS platforms, including Workday, Greenhouse and Lever.
Browse the Testlify test library of 3,500+ tests, or start a 7-day free trial, no credit card needed.
Frequently asked questions (FAQs)
Related resources
View all
HR & recruitment
How to create a positive blue collar workplace in 2027

HR & recruitment
Acing pre-employment tests: Strategies and tips

HR & recruitment
10 volume recruiting trends for enterprise HR teams

HR & recruitment
Pre-employment screening: types, process, and how assessment-first hiring improves quality of hire

HR & recruitment
How Skills Assessments Cut Time to Hire

HR & recruitment
Why skill-based assessments offer more precision in tech hiring
Get started.
Hire on proof, not resumes.
Run your first skills-based assessment free — no credit card required.