
How to measure strategic HR planning success: metrics and a scorecard
Measure your HR plan against its goals: one outcome metric and one leading signal per goal, a baseline, a target and a one-page scorecard.

Knowing how to measure strategic HR planning success comes down to one test: did the plan change the business results it was written for? Measure each goal with one outcome metric and one leading signal, record a baseline before you start, set a target and a date, and report the results on a one-page scorecard that leadership reads every quarter.
TL;DR / Key Takeaways
- Measure an HR plan against its own goals, not against a long list of HR metrics. Three to five goals, each with one outcome metric and one leading signal, is enough.
- Record a 12-month baseline before the plan starts. Without it, no result can be called a success.
- Track leading signals (pipeline, engagement, skills scores) monthly and outcomes (time to fill, quality of hire, regretted attrition) quarterly.
- Skills data is the most useful leading signal. SHRM found 69% of organizations still struggle to fill full-time roles, and 28% need new skills for them.
- Separate "did HR deliver the plan" from "did the plan change the business". Programs launched is not success; critical roles filled faster is.
- Report a one-page scorecard with baseline, target, actual and status for each goal, and change the plan when a leading signal stays red for two months.
 ChatGPT
 Gemini
 Claude
 Grok
 Perplexity
What does success look like for a strategic HR plan?
Success for a strategic HR plan means the workforce goals in the plan were met and those goals moved a business result, such as revenue per employee, delivery capacity or customer retention. Completing HR projects on time is part of the picture, but a plan that ships every project and leaves critical roles empty has not succeeded.
Most plans are built on the method described in our guide to strategic human resource planning: forecast the people the business will need, compare that with the people it has, and close the gap through hiring, development, mobility and retention. Measurement checks each of those moves at three levels:
- Delivery: Did HR do what the plan said, on time and on budget? Example: the graduate program launched in Q2.
- Workforce outcome: Did the workforce change as planned? Example: critical engineering roles now fill in 45 days instead of 70.
- Business impact: Did that change help the business? Example: the product team shipped the roadmap without contractor overspend.
Boards and CFOs care about the third level. HR teams often report only the first. A good measurement plan covers all three and is explicit about which is which.

How to measure strategic HR planning success step by step?
Measuring strategic HR planning success takes six steps: name the goals, pick metrics per goal, record a baseline, set targets and owners, review on a fixed cadence, and report and adjust. Each step is short, but skipping one, usually the baseline, makes the final result impossible to judge.
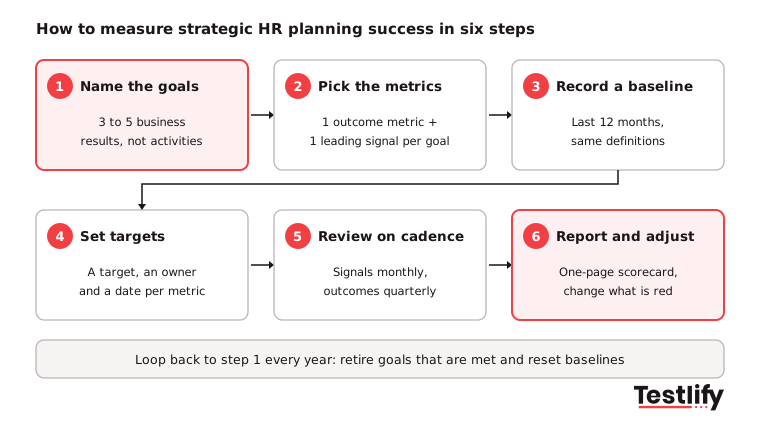
- Name the plan's goals: Write three to five goals as business results, not HR activities. "Cut time to fill for critical roles by 30%" works. "Improve recruiting" does not. If your plan is still in draft, our guide on how to create a strategic HR plan covers goal setting.
- Pick one outcome metric and one leading signal per goal: The outcome tells you if the goal was met. The leading signal warns you months earlier if it will not be.
- Record a baseline: Pull the last 12 months of data for every metric before the plan starts. Use the same definitions you will use later.
- Set a target, an owner and a date: Each metric gets one named owner (often an HR business partner or TA lead) and a target date that matches the plan horizon.
- Review on a fixed cadence: Leading signals monthly, outcomes quarterly, the whole plan once a year.
- Report and adjust: Share a one-page scorecard with leadership and change the plan when the numbers say it is not working.
AIHR's study of 50 top-performing companies found that the strongest HR strategies write the measurement cadence and the success metrics into the strategy itself, rather than adding them later. Treat steps 2 to 5 as part of the plan, not as a reporting task at year end.
Which metrics show whether an HR plan is working?
The metrics that show whether an HR plan is working are the ones tied to its goals: time to fill for critical roles, quality of hire, regretted attrition, skills coverage, succession coverage, workforce cost against plan and revenue per employee. Pick the rows that match your goals and ignore the rest.
Plan goal | Outcome metric | How to calculate it | Leading signal |
|---|---|---|---|
Fill critical roles on time | Time to fill (critical roles) | Days from approved requisition to accepted offer, averaged across critical roles | Critical-role vacancy rate, qualified candidates per open role |
Hire better people | Quality of hire | Average of first-year performance rating, ramp time and 12-month retention for new hires | Assessment scores of hires, hiring manager rating at 90 days |
Keep key talent | Regretted attrition | Regretted leavers / average headcount x 100 | Engagement or eNPS in key teams, internal moves |
Close skills gaps | Skills coverage | People meeting the target skill level / people in scope x 100 | Skills scores before and after training |
Build the leadership bench | Succession coverage | Critical roles with a ready-now successor / critical roles x 100 | Internal fill rate for leadership roles |
Control people cost | Workforce cost against plan | Actual workforce cost / planned workforce cost x 100 | Overtime hours, contractor share, cost of open roles |
Raise productivity | Revenue per employee | Revenue / average full-time equivalent headcount | Absenteeism rate, time to productivity for new hires |
Make hiring stick | Failed hires rate | New hires who leave or fail probation within 12 months / new hires x 100 | 90-day new hire survey, early performance check-ins |
The US Office of Personnel Management uses a similar split in its measuring results guide for strategic human capital planning, with strategic metrics (skills gaps closed, retention, time to hire against a standard), operational metrics (manager satisfaction with applicant quality, cost per employee against output) and employee metrics (applicant satisfaction, turnover against new hire rate).
For the formulas behind the most common people metrics, see our lists of key HR metrics and HR KPIs. Calculators help you set a consistent baseline: the quality of hire calculator, cost per hire calculator and attrition rate calculator.
Pro tip: Split every outcome metric by role group. A company-wide time to fill of 38 days can hide 75 days for the ten engineering roles the plan depends on.
What is the difference between leading and lagging HR metrics?
Leading HR metrics predict whether a goal will be met; lagging HR metrics confirm whether it was. Regretted attrition is lagging: you only see it after people leave. Engagement scores in the same team are leading: they drop months before the resignations arrive.
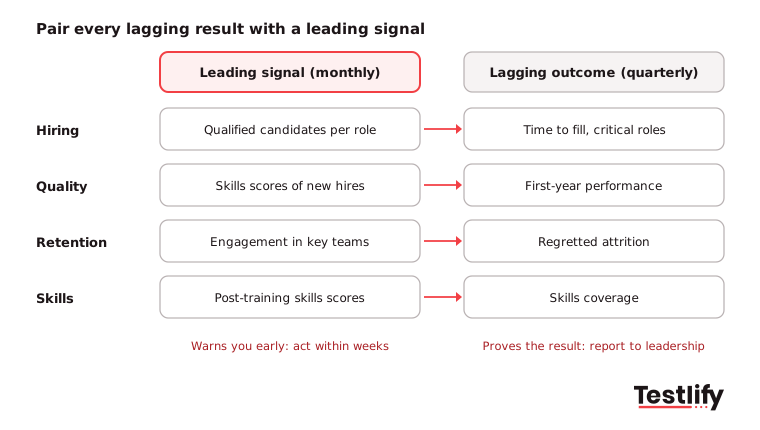
A plan measured only on lagging metrics gives you a clear answer too late to act on. A plan measured only on leading metrics gives early warnings with no proof of results. Pair them:
- Hiring: Qualified candidates per open role (leading) with time to fill for critical roles (lagging).
- Quality: Skills assessment scores of new hires (leading) with first-year performance and retention (lagging).
- Retention: Engagement in key teams and internal moves (leading) with regretted attrition (lagging).
- Skills: Training completion and post-training skills scores (leading) with skills coverage in critical roles (lagging).
How do you build a one-page HR planning scorecard?
An HR planning scorecard is a single table with one row per plan goal and columns for the metric, baseline, target, latest actual, owner and status. Leaders should be able to read it in two minutes and see which goals are on track, which are at risk and what HR is doing about the red rows.
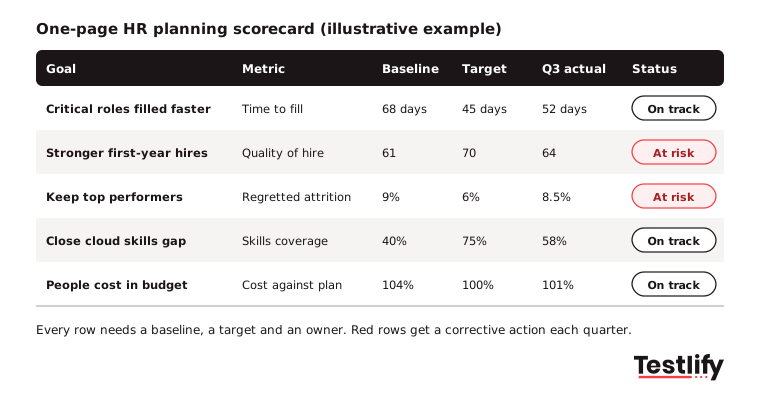
Here is an illustrative scorecard for a 600-person software company in the third quarter of a two-year plan. The numbers are an example, not a benchmark.Keep the scorecard short. If it needs a second page, the plan has too many goals or the goals are HR activities in disguise. The balanced scorecard approach works well if leadership already uses it for the rest of the business: the HR rows then sit next to finance, customer and process rows in the same format.
Key takeaway: A scorecard row is useful only when it has a baseline, a target and an owner. A metric with none of the three is a statistic, not a measure of success.
How often should you review the HR plan's results?
HR plan results should be reviewed on three rhythms: leading signals monthly, outcome metrics quarterly, and the whole plan once a year. Monthly reviews catch problems early, quarterly reviews show leadership real progress, and the annual review decides whether the goals themselves still fit the business.
- Monthly (HR team and TA leads): Pipeline per critical role, engagement pulse in key teams, offer acceptance, training completion. Act on anything red for two months in a row.
- Quarterly (HR leadership with business heads): The scorecard. Agree on corrective actions for every at-risk row.
- Yearly (executive team): Re-forecast demand, retire goals that are met, add new ones, and reset baselines.
Also review the plan outside the calendar when something big changes: an acquisition, a restructure, a new product line or a hiring freeze. The plan's numbers lose meaning once the business it was built for has changed. Put these review dates in the plan's rollout calendar on day one, so they happen even when the year gets busy.
Why does skills data matter most when you measure HR plan results?
Skills data matters most because almost every HR plan goal depends on having the right skills in the right roles, and skills scores move before hiring, retention and productivity results do. If skills coverage in a critical team is rising, faster delivery and better quality of hire usually follow.
The pressure is real. SHRM's 2025 Talent Trends survey of 2,040 HR professionals found that 69% of organizations still struggle to fill full-time roles, and 28% now need new skills for those roles. The same survey found AI use in HR tasks rose to 43% in 2025 from 26% in 2024, so more of the data you need is already being collected.
Skills are also the hardest thing to measure from HR systems alone. Job titles and course completions say little about what people can actually do. Three practical sources work better:
- Skills assessments at hiring: Score every candidate for a critical role on the same role-based test, then compare those scores with first-year performance. That turns quality of hire from a gut call into a number.
- Skills assessments for current staff: Test the team before and after training to see whether the skill gap analysis gap is closing.
- Internal mobility records: Track how many critical roles are filled through internal mobility, which shows whether the skills you built are being used.
Testlify's test library has 3,500+ role-based and skills tests, and its reporting adds benchmarking and per-skill breakdowns, so the same scores feed both hiring decisions and the skills rows of your scorecard. Results sync to 100+ ATS and HRIS tools, which keeps the data in one place for the quarterly review.
What mistakes make HR planning metrics misleading?
HR planning metrics mislead when they count HR activity instead of results, start without a baseline, average away the roles that matter, or compare against outside numbers that do not fit the business. Each mistake makes a weak plan look strong or a working plan look broken.
- Counting activity: "Twelve workshops delivered" is a delivery metric. Report it, but never as proof the plan succeeded.
- No baseline: A 7% attrition rate means nothing unless you know it was 10% before the plan.
- Too many metrics: Thirty metrics on a dashboard hide the five that decide the plan. Our list of mistakes to avoid in HR planning covers this and other planning errors.
- Averages only: Company-wide numbers hide critical roles, teams and locations. Split by segment.
- Wrong benchmarks: Outside figures help for context, not as targets. Gallup's State of the Global Workplace report found global engagement fell to 20% in 2025 and manager engagement fell from 27% to 22%. A flat engagement score in that climate may be a good result, so judge it against your own baseline and trend.
- Reading cause into correlation: Attrition may fall because the job market cooled, not because of a new career framework. Note outside factors next to each result.
When should you use HR strategic planning services?
HR strategic planning services make sense when the plan needs skills or capacity the HR team does not have: workforce forecasting, people analytics, a large restructure, a merger, or a new HRIS. The provider should help you measure success, not just write the plan, so ask up front which metrics it will commit to.
The HR strategic planning services market is large and growing. Market Research Future estimated it at USD 17.5 billion in 2024 and forecast USD 32.1 billion by 2035, a 5.67% annual growth rate, across consulting, implementation, training and support services. Estimates for wider HR consulting vary a lot by definition, so treat any single figure as one firm's view.
Before you hire a provider, check four things:
- Metrics in the contract: Which outcome metrics will the engagement move, from which baseline, by when?
- Data ownership: Will your team own the dashboards, definitions and data after the provider leaves?
- Fit with your tools: Does the work connect to your ATS, HRIS and reporting and analytics tools, or does it add a separate spreadsheet?
- Outcome over tooling: Deloitte's 2026 Global Human Capital Trends found that 59% of organizations take a tech-focused approach to AI, and those are 1.6 times more likely not to see returns above expectations. Buy services for the result on the scorecard, not for the tool.
For a workforce-plan view of the same question (headcount, supply and demand), see how to measure the success of a workforce plan. For deeper analysis across people data, our guide to human capital analytics covers the next step.
Ready to measure the skills side of your HR plan?
The skills and quality-of-hire rows are where most HR scorecards run out of data. Browse the Testlify test library to find role-based tests for your critical roles, or start a 7-day free trial, no credit card needed, and score your next hiring round on the same skills you plan to track. Larger teams can book a demo to see the reporting and ATS sync.
Frequently asked questions
Related resources
View all
HR & recruitment
How to create a strategic human resource plan in 8 steps

HR & recruitment
Steps in strategic human resource planning: a 6-step guide

HR & recruitment
The importance of strategic human resource planning

HR & recruitment
What is strategic human resource planning?

HR & recruitment
How to use technology to support new hire orientations?

HR & recruitment
Case studies of successful new hire orientation programs
Get started.
Hire on proof, not resumes.
Run your first skills-based assessment free — no credit card required.