
Data visualization exam for hiring: what to test and how to score it
How hiring teams build, run and score a data visualization exam for analyst and BI roles, with sample tasks, a rubric and fairness tips.

A data visualization exam in hiring is a timed skills test that checks whether a candidate can choose the right chart, build it accurately in the tools the job uses, read what a chart really says and explain the finding to people who are not analysts. It replaces the portfolio walkthrough and the "tell me about a dashboard you built" question with evidence you can compare across every applicant.
TL;DR:
- A data visualization exam for hiring should test six things: chart choice, accuracy, tool skill, chart reading, data preparation and storytelling.
- Keep the screening stage short. A 10 to 20 minute multiple-choice and chart critique round, then a 45 to 60 minute practical task for the shortlist, is enough for most analyst roles.
- Score with a written 1 to 5 rubric per skill, agreed before the first candidate starts, and have two reviewers score practical tasks.
- Match the tool to the job. Test Power BI or Tableau only when the role uses it from day one; otherwise test chart reasoning that carries across tools.
- Turn on proctoring and AI-assistance checks for the timed stage, and ask candidates to explain their chart in their own words in the next round.
- Skills-based screening widens the pool: LinkedIn found a skills-based approach grows talent pools a median 6.1x.
 ChatGPT
 Gemini
 Claude
 Grok
 Perplexity
What is a data visualization exam in hiring?
A data visualization exam in hiring is a structured test that measures how well a candidate turns data into charts that are correct, clear and useful for a decision. It is different from a course final or a certification exam, which check what a learner studied. A hiring exam checks whether the person can do the job you are filling.
That difference matters because most results for this search are university papers and practice quizzes. They test theory, such as naming chart types. A hiring team needs to know something narrower: can this candidate take your kind of data, in your tools, and produce a chart a sales director or CFO will read correctly in ten seconds?
Course or practice exam | Certification exam | Hiring exam | |
|---|---|---|---|
Who sets it | University or training site | Vendor, such as Microsoft for Power BI | Your hiring team |
What it checks | Theory and chart vocabulary | Product skills across a full syllabus | The skills one role needs on day one |
Length | 1 to 3 hours | About 2 hours | 10 to 60 minutes per stage |
Result | Grade | Pass or fail | Ranked shortlist with per-skill scores |
Best use | Learning | Proof of tool knowledge | Comparing applicants fairly |
Skills-based screening also widens who you can consider. LinkedIn's 2025 skills-based hiring report found that searching on skills instead of past job titles grows talent pools a median 6.1x globally.

Which roles need a data visualization exam?
Data visualization exams fit any role where charts drive decisions: data analysts, BI analysts and developers, data scientists, marketing and finance analysts, and product analysts. The weight you give each skill changes by role, so the exam should change too.
Demand is not slowing. The US Bureau of Labor Statistics projects data scientist jobs to grow 35% from 2025 to 2035, with about 24,800 openings a year, and notes that these scientists often present findings with data visualization.
Role | What the exam should stress | Tools to test |
|---|---|---|
Data analyst | Chart choice, accuracy, reading charts | Excel or Google Sheets, plus the team's BI tool |
BI analyst or developer | Dashboard design, data prep, filters and drill-downs | |
Data scientist | Exploratory charts, distributions, uncertainty | Python or R plotting |
Marketing or finance analyst | Trend reading, plain-language summaries | Spreadsheets and the reporting tool in use |
Product or ops manager | Reading dashboards and spotting misleading charts | Tool-neutral |
For the wider hiring process around the exam, see these best practices for hiring data analysts.
What should a data visualization exam measure?
A data visualization exam should measure six skills: choosing the right chart, building it accurately, using the job's tools, reading and questioning charts, preparing the data, and telling a clear story with it. Leave out any skill the role does not use, and weight the rest by how often the job needs them.
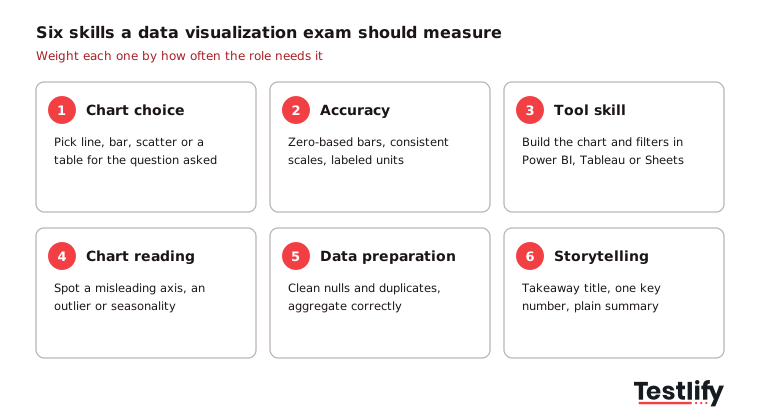
- Chart choice: Picks a line for trends, a bar for comparisons and a scatter for relationships, and knows when a table beats a chart.
- Accuracy and honesty: Starts bar axes at zero, keeps scales consistent, labels units and avoids 3D or dual axes that distort.
- Tool skill: Builds the chart, filters and calculated fields in the tool the team uses.
- Chart reading: Spots a misleading chart, an outlier or a trend that is really seasonality.
- Data preparation: Cleans nulls, fixes types and aggregates correctly before charting.
- Storytelling: Leads with the answer, highlights the one number that matters and writes a takeaway title.
Vendor syllabi agree on the weight of this work. In the Microsoft PL-300 Power BI Data Analyst exam, "Visualize and analyze the data" is 25 to 30% of the skills measured, the same share as data preparation.
How do you build the exam for a specific analyst role?
Building a data visualization exam for one role takes six steps: list the role's real chart tasks, pick the skills and weights, choose question formats, write the scoring rubric, run the timed screen, then review practical work for the shortlist. Most teams can set this up in an afternoon when they start from a ready-made test.
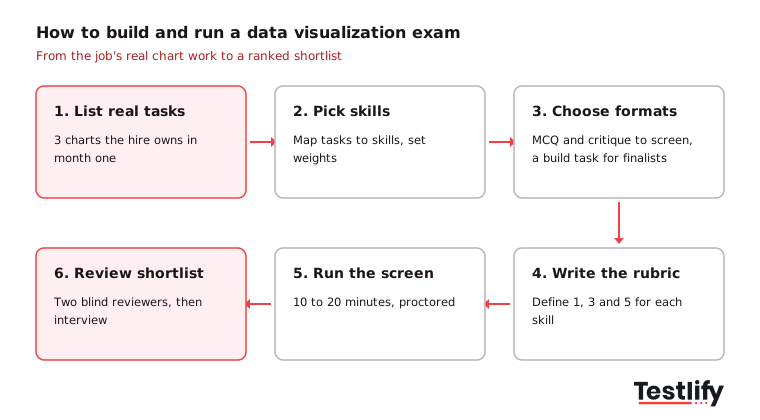
- List the real tasks: Ask the hiring manager for three charts or dashboards the new hire will own in month one.
- Pick skills and weights: Map each task to the six skills above. A BI developer might weight tool skill at 30%; a marketing analyst might weight storytelling at 30%.
- Choose formats: Use multiple-choice and chart critique for the screen, and a practical build task for finalists.
- Write the rubric: Define what a 1, 3 and 5 looks like for each skill before anyone takes the exam.
- Run the timed screen: Keep it to 10 to 20 minutes, with proctoring on, so strong candidates do not drop out.
- Review the shortlist: Two reviewers score practical work blind, then compare notes in a structured interview.
Pro tip: Build the practical task from a cleaned, anonymized slice of your own data. Candidates show far more when the data looks like the job, and you learn whether they ask the right questions about it.
What do good exam questions look like?
Good data visualization exam questions show a candidate a chart or a dataset and ask for a decision, not a definition. Questions that ask "what is a histogram?" reward memory; questions that ask "which chart would you show the CFO, and why?" reward judgment.
Use a mix of formats across the two stages:
- Chart choice (multiple choice): "Monthly revenue for 3 regions over 24 months. Which chart shows the trend for each region most clearly?" A good answer picks a line chart with 3 lines, not a pie or stacked area.
- Chart critique: Show a bar chart whose y-axis starts at 80. Ask what is wrong and how big the real difference is.
- Chart reading: Show a scatter plot with one extreme point. Ask what the candidate would check before reporting the correlation.
- Data prep: Give a table with blank and duplicated rows. Ask how they would clean it before building a weekly sales chart.
- Practical build (45 to 60 minutes): Provide a CSV and a business question. Ask for one dashboard page and a three-sentence summary.
- Spoken follow-up: Ask the candidate to explain one chart in two minutes to a non-analyst, by video or in a live interview.
The Testlify library also offers a ready AI interview for data visualization for that spoken round, and our tips for judging data visualization work go deeper on portfolio review.
How should you score a data visualization exam?
A data visualization exam should be scored automatically for objective items and with a written 1 to 5 rubric for practical work. Agree the rubric before the first candidate starts, weight each skill for the role, and have two people score practical tasks so one reviewer's taste does not decide the hire.
Skill | 1 (weak) | 3 (meets the bar) | 5 (strong) |
|---|---|---|---|
Chart choice | Chart type hides the answer | Correct type, some clutter | Best type, nothing extra |
Accuracy | Wrong numbers or distorted axes | Correct, minor labeling gaps | Correct, labeled, units clear |
Tool skill | Could not finish in the tool | Finished with basic features | Used filters, measures or parameters well |
Data prep | Charted dirty data | Cleaned obvious issues | Cleaned and explained choices |
Storytelling | No takeaway | Takeaway in the summary | Takeaway in the title, one key number highlighted |
Certification graders apply similar checks. According to DataCamp's certification support guide, the most common reason candidates fail its Data Analyst and Data Scientist practical exams is not meeting the data visualization criteria, such as showing at least one chart with two or more variables and using charts that support the findings.
Key takeaway: Set a pass mark per skill, not just an overall score. A candidate who scores 5 on tool skill and 1 on accuracy will build fast dashboards with wrong numbers.
What mistakes make data visualization testing unreliable?
Data visualization testing goes wrong in five common ways: testing a tool the job does not use, running take-home tasks that take a full day, judging on taste instead of a rubric, ignoring AI help, and using the same public questions every time. Each one either filters out good people or lets weak ones through.
- Tool lock-in: Rejecting a strong Tableau user for a role you could teach Power BI in two weeks shrinks your pool for no reason.
- Unpaid marathons: Tasks longer than an hour or two drive drop-off and hurt candidate experience, especially for people who already have a job.
- Taste over evidence: "I do not like the colors" is not a score. Tie every comment to a rubric row.
- AI and copy-paste help: Chat tools can write a summary or suggest a chart in seconds. Use proctoring for the timed stage and a spoken follow-up for the practical one.
- Leaked questions: Rotate or randomize questions so answers shared online lose their value.
Good recruitment data visualization exams avoid these by keeping the screen short, objective and proctored, and saving open-ended work for a small shortlist.
How does Testlify help you run the exam?
Testlify runs a data visualization exam as a ready-to-use test you can send in minutes, combine with tool tests, proctor and score automatically. Its data visualization assessment is a 10-minute, 10-question intermediate test covering data analysis, Tableau and Power BI, built for data analyst, BI analyst, data manager and data scientist roles.
- Mix in tool tests: Add a Tableau, Power BI or Looker test, a data storytelling test or a data analyst test from a library of 3,500+ tests.
- Add practical work: Use any of 25+ question types, including file upload, practical tasks, MS Excel and Google Sheets uploads, coding and video answers, for the shortlist round.
- Build from the job description: The AI test builder generates a role-specific assessment from a job description in under a minute.
- Keep it honest: 20+ proctoring checks include AI assistance detection, copy-paste tracking, tab proctoring and webcam snapshots.
- Compare fairly: Automated scoring, weighted scores, per-skill breakdowns and benchmarking give every candidate the same yardstick, and results sync to 100+ ATS and HRIS tools.
Ready to test data visualization in your next hire?
Start with the ready-made test, add the tool test your team uses, and send it to your next batch of analyst applicants. Testlify is credit-based, so you pay only when a candidate starts, and there is a 7-day free trial with no credit card. Browse the test library or book a demo to see the scoring and reports on your own roles.
FAQs

Senior SEO Specialist
Soham is a senior SEO specialist specializing in B2B HR tech. He covers search, answer, and generative engine optimization (SEO/AEO/GEO) for talent acquisition, skills-based hiring, and assessment-driven recruiting audiences.
LinkedInRelated resources
View all
Skill assessment
How to evaluate candidates’ skills with a full stack developer test

Skill assessment
How to evaluate candidates’ skills with a C# assessment

Skill assessment
WordPress developer skills: what to look for and how to assess them

Skill assessment
How to evaluate candidates’ skills with a Docker assessment

Skill assessment
How to evaluate candidates’ skills with a TypeScript assessment

Skill assessment
How to evaluate candidates’ skills with an accounting manager test
Get started.
Hire on proof, not resumes.
Run your first skills-based assessment free — no credit card required.