
Talent management metrics: 15 KPIs, formulas and ROI
The talent management metrics HR leaders should track, how to calculate each one, when to review it, and how to prove the ROI to finance.

Talent management metrics are the numbers that show whether your hiring, development, performance and retention programs are working. They cover the whole employee lifecycle, from time to hire and quality of hire to internal mobility and regretted attrition, and they turn a talent strategy into results a leadership team can check.
Most teams already collect more data than they use. The hard part is picking the few metrics that match this year's business goal, calculating them the same way every time, and showing finance what the numbers are worth. This guide gives you the 15 metrics, a formula for each, a review cadence and a worked ROI example.
TL;DR:
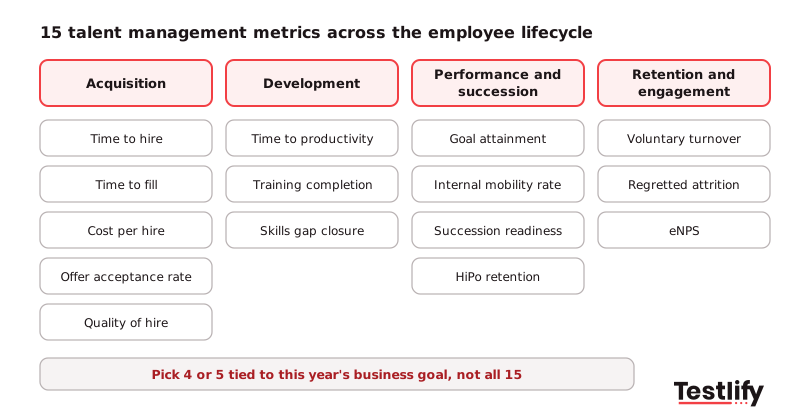
- Talent management metrics measure hiring, development, performance and succession, and retention. Track 4 or 5 tied to one business goal, not all 15.
- Quality of hire shows whether hiring works, yet only 20% of organizations measured it in 2025, according to SHRM.
- Median cost per hire was $1,200 for nonexecutive roles and $10,625 for executives in 2025. Median nonexecutive time to fill was 39 days in 2026.
- Retention is where the money usually is. Gallup puts replacement cost at about 40% of salary for frontline staff and 200% for managers.
- Talent management ROI = (attributed benefit - program cost) / program cost x 100. Discount the benefit for everything else that changed before you present it.
- Read leading metrics quarterly and calculate ROI once a year. Retention and development programs need 12 to 24 months to show a return.
 ChatGPT
 Gemini
 Claude
 Grok
 Perplexity
What are talent management metrics?
Talent management metrics are measures that track how well an organization attracts, develops, promotes and keeps its people. Each one links a talent activity to an outcome, such as cost per hire to recruiting spend or internal mobility rate to development programs, so HR can see which programs work and which need to change.
The terms metric and KPI are often used as if they mean the same thing. A metric is any number you track. A talent management KPI is a metric you have tied to a target, such as "cut first-year attrition in customer support from 34% to 22% by December." Every KPI is a metric, but only the few that decide whether the talent management strategy succeeded deserve KPI status.
Talent management metrics also differ from general HR metrics. HR metrics include payroll accuracy, benefits enrollment and compliance figures. Talent metrics focus on the people pipeline: who you hire, how fast they grow, whether they move up and whether they stay.

Why do talent management metrics matter?
Talent management metrics matter because they show leaders where talent spend pays off and where people are slipping away unnoticed. Without them, a talent strategy is judged on opinion, and budget reviews favor the program with the best story rather than the best results.
Turnover is the clearest example. Gallup's research on preventable turnover found that 42% of employees who quit in the past year say their manager or organization could have done something to keep them. 45% said no manager or leader had talked with them about their satisfaction, performance or future in the three months before they left. Metrics such as regretted attrition and high-potential retention surface that risk while there is still time to act.
Good talent management metrics also help you:
- Defend budget: A program that shows lower first-year attrition in dollars survives a cost review. One that reports "engagement went up" rarely does.
- Fix the right stage: When quality of hire drops but time to productivity holds, the problem is selection, not onboarding.
- Spot skills gaps early: Low internal fill rates tell you development is not producing people ready for the next role.
- Hire with less bias: Structured, scored data replaces gut feel in hiring and promotion decisions.
Which talent management metrics should you track?
The talent management metrics most teams should track fall into four groups: acquisition, development, performance and succession, and retention and engagement. The table below gives a formula for each of the 15 metrics and where the data usually lives, so two people pulling the same number get the same answer.
# | Metric | Formula | Where the data lives |
|---|---|---|---|
1 | Time to hire | Offer accepted date - date the candidate entered the pipeline | ATS |
2 | Time to fill | Offer accepted date - requisition open date | ATS |
3 | Cost per hire | (Internal + external recruiting costs) / number of hires | Finance + ATS |
4 | Offer acceptance rate | Offers accepted / offers made x 100 | ATS |
5 | Quality of hire | Average of new-hire performance, 12-month retention and hiring manager rating (each as %) | Performance system + HRIS |
6 | Time to productivity | Days from start date to an agreed output level for the role | Manager sign-off |
7 | Training completion rate | Employees who completed / employees enrolled x 100 | LMS |
8 | Skills gap closure | (Gap at start - gap at end) / gap at start x 100, per critical skill | Skills assessments |
9 | Goal attainment rate | Goals met / goals set x 100 | Performance system |
10 | Internal mobility rate | Internal moves (promotions + transfers) / average headcount x 100 | HRIS |
11 | Succession readiness | Critical roles with a ready-now successor / total critical roles x 100 | Talent review |
12 | High-potential retention | HiPos still employed at period end / HiPos at period start x 100 | HRIS + talent review |
13 | Voluntary turnover rate | Voluntary leavers / average headcount x 100 | HRIS |
14 | Regretted attrition | Leavers the manager wanted to keep / total leavers x 100 | Exit process |
15 | Employee net promoter score (eNPS) | % promoters (9-10) - % detractors (0-6) | Pulse survey |
Acquisition metrics
Acquisition metrics show whether you bring in the right people at a sensible cost and speed. For benchmarks, SHRM's 2026 Recruiting Executives Benchmarking, based on data from over 4,600 organizations, puts the median time to fill for nonexecutive roles at 39 calendar days, down from about 44 days in 2025. SHRM's 2025 report found a median cost per hire of $1,200 for nonexecutive roles and $10,625 for executive roles, a gap that has widened since 2017.
Free calculators for cost per hire and offer acceptance rate make these quick to run.
Development metrics
Development metrics show whether learning spend builds skills the business needs. Completion rate alone says little: pair it with skills gap closure, measured by assessing the same skills before and after a program, and with time to productivity for new hires.
Performance and succession metrics
Performance and succession metrics show whether your pipeline can fill tomorrow's critical roles from inside. Track internal mobility, the share of critical roles with a ready-now successor, and the retention of your high-potential employees separately from everyone else.
Retention and engagement metrics
Retention and engagement metrics show whether people stay and would recommend you as an employer. Split turnover into voluntary and involuntary, then split voluntary into regretted and non-regretted. An overall turnover rate can look healthy while your best performers leave. The eNPS calculator turns survey answers into a score in seconds.
How do you measure quality of hire?
Quality of hire is measured by combining two or three post-hire signals into one score per hire, then averaging it by role, source or recruiter. The most common inputs are the new hire's first performance rating, whether they are still employed at 12 months, and the hiring manager's satisfaction with the hire.
The metric is valuable and still rare. SHRM's 2025 benchmarking found that only 20% of organizations use quality-of-hire measures, down from 27% in 2022, even though 61% of recruiting executives call a lack of qualified candidates a challenge. The three inputs used most often were interviews to evaluate performance, performance appraisal scores and retention rates.
To make quality of hire useful, link it back to what you measured before the hire:
- Score every candidate the same way: Use the same role-specific skills assessment and structured interview for everyone hired into a role.
- Join pre-hire and post-hire data: Match assessment scores to 12-month performance ratings and retention in the same record.
- Compare high and low scorers: If top scorers outperform and stay longer, your selection signal works. If not, fix the criteria before you hire the next cohort.
The quality of hire calculator gives you a starting score, and the guide on how to improve quality of hire covers what to change when the number is low.
Key takeaway: Pre-hire assessment data is the one input a talent team fully controls, which makes it the easiest place to prove that what you measured before the hire predicted what happened after it.
Which talent management metrics are leading and which are lagging?
Leading talent management metrics move early and warn you about a problem, while lagging metrics confirm the result months later. Offer acceptance, training completion and eNPS are leading. Voluntary turnover, quality of hire and succession readiness are lagging. A good scorecard pairs each lagging outcome with one or two leading signals.
Metric type | Examples | Review cadence |
|---|---|---|
Leading | Offer acceptance rate, assessment completion, training completion, eNPS, manager adoption | Monthly or quarterly |
Mid-term | Time to productivity, first-year attrition, internal fill rate | Quarterly or per hiring cohort |
Lagging | Quality of hire, regretted attrition, succession readiness, HiPo retention | Every 6 to 12 months |
Financial | Talent management ROI | Once a year |
Anything tied to promotion readiness or succession needs 18 to 24 months before the data means much. Reading an ROI number at month three produces noise, and a bad early reading can kill a good program.
Pro tip: If a program is cheap to stop, check its leading indicators at 90 days. You are not computing a return yet, only checking that people actually use what you bought. A program nobody adopted will never produce a return, and you do not need a year to learn that.
How do you measure the success of a talent management strategy?
The success of a talent management strategy is measured in five steps: set a numeric objective, pick the KPIs for each talent area, source the data from named systems, review it on a fixed cadence, and adjust the program based on what the numbers show. The cycle then repeats, with next year's objective coming from this year's data.
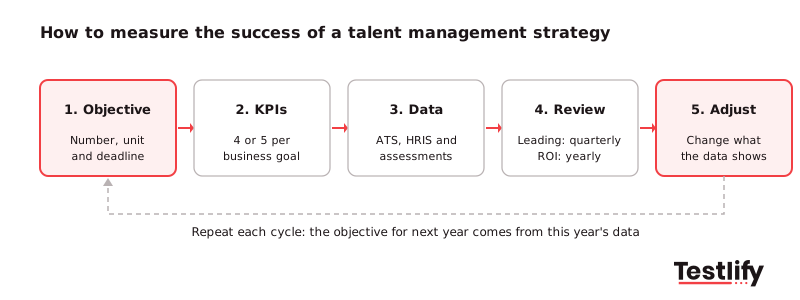
- Set a clear, measurable objective: Tie it to the business plan. "Fill 70% of team lead roles internally by Q4" can be measured; "build a leadership culture" cannot.
- Pick the KPIs for each talent area: Recruitment and onboarding use time to fill, quality of hire and onboarding completion. Development uses skills gap closure and training ROI. Performance uses goal attainment. Succession uses internal promotion rate and bench strength. Engagement and retention use eNPS and regretted attrition.
- Source the data from named systems: Your ATS, HRIS, LMS and assessment platform hold most of it. A talent management software platform or an HR analytics layer can pull these into one view, but agree on definitions first.
- Review on a fixed cadence: Leading metrics quarterly, lagging metrics twice a year, ROI once a year. Look for trends and patterns across teams, not one-off movements.
- Adjust and ask employees: Use the data to refine recruiting, training or appraisal practices. Employee feedback from pulse surveys and stay interviews explains why a number moved.
How do you calculate talent management ROI?
Talent management ROI is calculated as the attributed benefit minus the program cost, divided by the program cost, times 100. Benefits are usually costs avoided rather than revenue earned: fewer resignations, shorter vacancies, faster ramp and less overtime or agency spend. Costs include tools, content, facilitators and the hours managers give up.
ROI (%) = (attributed benefit - total program cost) / total program cost x 100
A defensible calculation follows four steps, in order:
- Define the business outcome first: Write it as a number, a unit and a deadline, for example "reduce first-year attrition in claims handling from 34% to 22% this year."
- Count the full cost: Include software, licenses, content, external facilitators and internal time. Manager time is the most often missed cost and can be the largest one in a development program.
- Convert the outcome into money: Agree the conversion factor with finance before you calculate. Seven fewer resignations only become a benefit once you multiply them by the cost of replacing each person.
- Discount for everything else: Your program is rarely the only thing that changed. Credit it with only the share of the improvement it actually drove.
Replacement cost usually carries most of the benefit. According to Gallup, replacing an employee costs about 40% of salary for frontline roles, 80% for technical professionals and about 200% for leaders and managers. Use the low end of any range when you build a business case. A figure that survives a skeptical read is worth more than a bigger one that gets picked apart in the meeting.
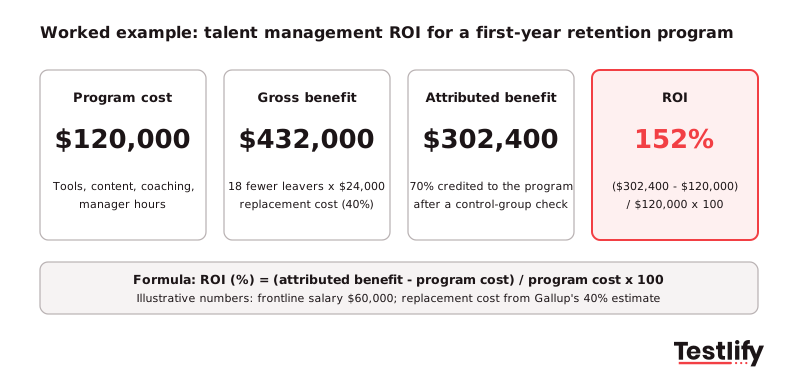
Here is how the numbers work in practice. A retention program costs $120,000 and first-year leavers in a frontline team fall by 18. At a $60,000 salary and Gallup's 40% estimate, each avoided exit is worth $24,000, so the gross benefit is $432,000. A control-group comparison credits 70% of the drop to the program, which gives an attributed benefit of $302,400 and an ROI of 152%.
There is no universal benchmark for a good ROI, because the base varies enormously between a $10,000 pilot and a $2 million program. A conservatively discounted 150% return is stronger evidence than an unadjusted 600% that assumes the program caused every improvement that year. Keep the hiring side on its own view: recruiting ROI runs on a shorter clock than development and retention.
How do you isolate the talent effect from everything else?
Isolating the talent effect means estimating how much of an improvement your program caused, separate from the labor market, a new manager, pay changes or a good quarter. Isolation is the step most ROI analyses skip, and it is the reason finance teams trust the number when it is done.
Start by reading your own attrition against the market. The US Bureau of Labor Statistics JOLTS release recorded 3.4 million quits in September 2026, a quits rate of 2.1%, against 5.4 million hires. When the market rate moves and yours does not, that is a finding. When both move together, your program probably did less than the raw number suggests.
Then use one of three methods:
- Control group: Run the program in three regions and hold two back, then compare. If holding back feels unfair, use a staggered rollout so the later groups give you a comparison period.
- Trend line: Use 24 months of history to project where the metric was heading, then measure the gap between forecast and actual. The method is weaker when the market shifts sharply.
- Discounted manager estimate: Ask managers what share of the change they credit to the program and how confident they are, then multiply the two. A 70% share at 80% confidence gives a 0.56 factor.
Write the isolation method into the program plan before launch, not into the report afterwards. Choosing the method once you have seen the results turns a business case into a story, and reviewers can tell the difference.
What is the difference between workforce management ROI and talent management ROI?
Workforce management ROI measures how efficiently you deploy the people you already have, while talent management ROI measures the quality, growth and retention of those people. Both can sit in the same budget conversation, but they run on very different clocks, so judging one against the other can make a good program look like a bad investment.
Comparison area | Workforce management ROI | Talent management ROI |
|---|---|---|
Core question | Are we using our workforce efficiently? | Are we hiring, developing and keeping the right people? |
What it covers | Scheduling, staffing levels, labor cost, coverage, overtime | Hiring quality, development, performance, succession, retention |
Typical benefits | Fewer overtime hours, better coverage, lower labor cost | Better hires, stronger skills, lower regretted turnover, internal pipeline |
When results appear | Within weeks or a quarter | Usually over 12 to 24 months |
Best metrics | Overtime, labor cost per hour, utilization, schedule adherence | Quality of hire, time to productivity, internal mobility, retention |
If both programs report to the same committee, state the ROI clock for each before presenting the numbers. Otherwise a talent program gets judged at month six against a workforce management benchmark it was never designed to meet.
What mistakes make talent management metrics misleading?
Talent management metrics mislead when teams track too many of them, define them loosely, or read them without context. The fix is fewer, better-sourced numbers that each answer a decision someone actually has to make.
- Tracking everything: Five metrics you can source reliably beat fifteen you rebuild by hand each quarter. Start with the three talent decisions leadership will make this year.
- Loose definitions: If two analysts would calculate time to fill differently, the metric is not ready for a business case. Write the formula and data source down.
- Averages that hide the problem: Company-wide turnover can look fine while one critical team or your top performers leave. Segment by role, team and performance level.
- Ignoring the manager effect: Gallup's State of the Global Workplace reports that global engagement fell to 20% in 2025, and manager engagement dropped from 27% to 22%. Engagement and retention metrics should be read by manager, not only by company.
- Claiming all the credit: An ROI figure that assumes your program caused every improvement will be discounted by finance anyway. Discount it yourself first.
Ready to measure quality of hire from the first assessment?
Quality of hire, time to productivity and first-year attrition all get easier to prove when every candidate is scored on the same role-specific skills before the first interview. Testlify gives you a library of 3,500+ tests, AI candidate insights with a per-skill breakdown, benchmarking and CSV or PDF export through its reporting and analytics, and two-way sync with 100+ ATS and HRIS tools, so pre-hire scores sit next to post-hire outcomes.
Browse the Testlify test library or book a demo to see how assessment data feeds your talent management metrics.
Frequently asked questions (FAQs)

Content Writer
Yashika Khandelwal is a Content Writer with 3+ years of experience creating research-backed content on hiring, talent assessment, and HR technology. She is a registered Organizational Psychologist and subject matter expert who combines behavioral science with practical recruitment insights to produce accurate, evidence-based content.
LinkedInRelated resources
View all
HR & recruitment
The importance of talent management in today’s economy

HR & recruitment
Benefits of Organizational Development: 10 Gains and How to Measure Them

HR & recruitment
How to create a workplace where employees thrive?

HR & recruitment
What is workforce planning? Process, types and examples

HR & recruitment
Common mistakes to avoid in succession planning

HR & recruitment
Succession planning process: 7 steps for HR teams in 2026
Get started.
Hire on proof, not resumes.
Run your first skills-based assessment free — no credit card required.