
Tips to evaluate data analysis skills when hiring in 2027
Eight practical ways to test how candidates clean, analyze and explain data, plus tool checks, role-level tweaks and red flags to watch.

The best tips to evaluate data analysis skills all come down to one idea: watch candidates work with real data instead of reading what their CV says about it. A short skills test, a work sample built on your own kind of data, a few statistics scenarios and a structured interview scored on one scorecard will tell you more in a week than a stack of CVs listing Excel, SQL and Python.
TL;DR:
- Judge data analysis skills on evidence: a 30 to 45 minute skills test, then a short real-data work sample.
- Test six areas: interpretation, tools, cleaning, visualization, statistics and communication.
- Test tools on the stack the role uses each week, not a CV tool list.
- Use scenarios, such as an 18% overnight drop in conversions, to test statistics.
- Score everyone on one weighted scorecard and keep take-homes under 2 hours.
- The biggest red flag: numbers produced without checking the data behind them.
 ChatGPT
 Gemini
 Claude
 Grok
 Perplexity
What are data analysis skills?
Data analysis skills are the abilities to collect, clean, explore and interpret data, then turn the results into a clear recommendation someone can act on. They combine technical skills, such as SQL, spreadsheets and statistics, with judgment: knowing which question to ask, which data to trust and what the numbers really mean for the business.
Demand for these skills is broad. The World Economic Forum's Future of Jobs Report 2025 found that analytical thinking remains the top core skill for employers, with seven out of 10 companies calling it essential, and that AI and big data top the list of fastest-growing skills.
Skill area | What good looks like | Best way to test it |
|---|---|---|
Data interpretation | Spots the patterns that matter and explains why | Data interpretation test, work sample |
Tool proficiency | Uses SQL, Excel or Python fluently on the role's stack | Hands-on tool test |
Data cleaning | Finds missing values, duplicates and outliers before analysis | Messy-dataset task |
Visualization | Picks the right chart and labels it clearly | Dashboard or chart task |
Statistical reasoning | Knows when a result is real and when it is noise | Scenario questions |
Communication | Explains findings to people who are not analysts | Presentation in the interview |

Why should hiring teams test data analysis skills instead of trusting CVs?
Hiring teams should test data analysis skills because a CV shows which tools a candidate has touched, not whether they can find the right answer in messy data. Two candidates can both list SQL, Tableau and Python; only a task shows which one checks the data, picks a sound method and explains the result clearly.
Testing skills also widens the pool. The LinkedIn Economic Graph skills-based hiring report (March 2025) found that hiring on skills instead of past job titles expands talent pools by a median 6.1x globally. For analyst roles, that means career switchers from finance, operations or research who can do the work but never held the title.
For TA teams under pressure on time-to-hire, a short test early in the funnel also replaces hours of CV screening with a ranked shortlist based on what candidates can actually do. See what skills-based hiring is and why it matters for the wider case.
What are the best tips to evaluate data analysis skills?
The best tips to evaluate data analysis skills are to define the analysis the role does, screen with a short skills test, run a work sample on realistic data, check tools on your stack, probe statistics with scenarios, score communication, use a structured interview and decide with one scorecard. Each tip below covers what to check and how.
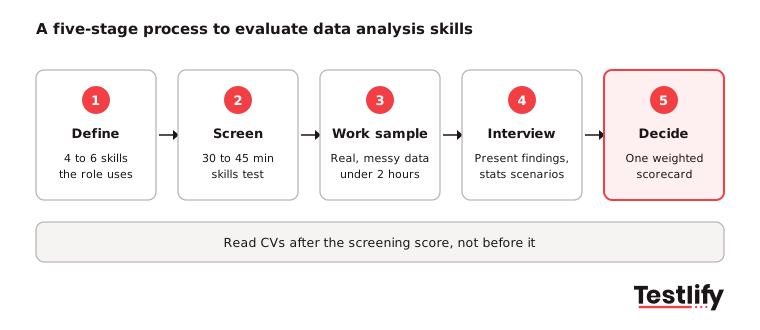
1. Define the analysis the role actually does
Start with the work, not the job title. A marketing analyst who builds weekly campaign reports needs different skills from a finance analyst who models forecasts or a product analyst who reads A/B tests.
- Goals: What decisions will this person's analysis support? Pricing, campaign spend, churn, staffing?
- Data types: Structured tables from a warehouse, spreadsheets from other teams, or unstructured text such as survey comments?
- Weekly tasks: Cleaning and preparing data, running statistical tests, building dashboards or presenting to leaders?
Write down the 4 to 6 skills that matter most and test only those. Testing everything makes assessments long and pushes good candidates to drop out.
2. Screen with a short skills test before reading CVs
Put a 30 to 45 minute skills test at the top of the funnel. A mix of a data analysis test, a data interpretation test and one tool test, such as SQL or Excel, gives every applicant the same questions and an objective score. Invite the top scorers to the next stage and read their CVs then, with the score in hand.
3. Test interpretation and insight generation with real data
Give candidates a small dataset and a business question, such as "Which customer segment should we invest in next quarter?" Then look for five things:
- Understanding of the data: Do they grasp the context, the variables and how they relate? Do they pick the data points that fit the question?
- Analytical thinking: Do they break the problem down, form a hypothesis and choose a sensible method?
- Pattern recognition: Do they find meaningful trends and correlations, and tell them apart from coincidences?
- Critical analysis: Do they question assumptions, check data quality and consider bias in how the data was collected?
- Actionable insights: Do they end with a clear recommendation and what it means for the business?
4. Check tool proficiency on your own stack
Test the tools the role uses every week, at the level the role needs. Can the candidate filter, sort, join and aggregate data? Can they build a clear chart? Can they automate a repetitive step with a formula, a script or a scheduled query? The next section covers what to check tool by tool.
5. Give a data cleaning and visualization work sample
Real data is messy, so the work sample should be too. Include missing values, duplicate rows, inconsistent date formats and one or two outliers. Ask the candidate to clean the data, reshape it for analysis and build one chart or a small dashboard that answers the question.
- Data cleaning: Do they spot and handle missing values, outliers and inconsistencies, and explain their choices?
- Data transformation: Can they merge, aggregate, pivot and create derived fields such as growth rates or cohorts?
- Visualization: Do they choose the right chart type, label it clearly and avoid clutter?
- Exploration: Do they use charts to find patterns and new questions, not only to decorate the result?
Keep any take-home under 2 hours, say how it will be scored, and send feedback afterwards. Candidates notice when a "short task" takes a weekend.
Pro tip: Plant one deliberate data problem in the dataset, such as a duplicated month or a currency mix-up. Strong analysts find it without being told. It is the fastest way to see who checks data before trusting it.
6. Probe statistical reasoning with scenarios
Skip textbook definitions and ask what the candidate would do. Good scenarios include:
- "Conversions dropped 18% overnight. What do you check first?" (tracking changes, data pipeline issues, seasonality, a real change in behavior)
- "An A/B test shows a 3% lift with 400 users per group. Would you ship it?" (sample size, significance, test length)
- "Average order value went up, but revenue went down. How is that possible?"
Listen for sound basics: descriptive statistics such as mean, median and spread; hypothesis testing and confidence intervals; correlation versus causation; and how test design, such as random assignment and control groups, prevents misleading results. For a deeper set of questions, see our tips to evaluate statistical analysis skills.
7. Score how candidates communicate findings
An analysis nobody understands changes nothing. Ask the candidate to present their work sample in 10 minutes to a mixed panel, then score:
- Clarity and structure: Do they lead with the answer and keep the supporting detail short?
- Visual communication: Do their charts make the point on their own?
- Context: Do they tie the finding to a business goal and say what to do next?
- Storytelling: Does the presentation build from question to evidence to recommendation?
- Audience fit: Can they switch between technical detail for analysts and plain language for a sales leader?
8. Use a structured interview and one scorecard
Ask every candidate the same questions and score answers on the same anchored scale. Weight the scorecard to the role; a reporting analyst might use communication 25%, interpretation 25%, tools 20%, cleaning 15% and statistics 15%. A structured interview with an interview scorecard keeps panel members from scoring on gut feel, and it gives you a clear record of why one candidate beat another.
Key takeaway: No single method is enough. A skills test shows knowledge, a work sample shows how candidates handle real data, and a structured interview shows how they think and explain. Use all three for any analyst hire that matters.
How do you evaluate data analysis software proficiency?
Data analysis software proficiency is best evaluated with a hands-on task in the exact tools the role uses, at the depth the role needs. A candidate who can write a clean SQL join, build a pivot table and explain a chart is proficient; a candidate who only names the tools is not.
Tool | What to check | Example task |
|---|---|---|
Excel or Google Sheets | Formulas, lookups, pivot tables, charts, data cleaning | Clean a sales export and summarize revenue by region |
SQL | Joins, aggregation, window functions, filtering | Find the top 10 customers by spend in the last 90 days |
Python or R | pandas or dplyr, data cleaning, basic statistics | Load a CSV, fix data types and compare two groups |
Power BI or Tableau | Data model, measures, clear dashboard design | Build a one-page dashboard for a weekly business review |
Beyond the basics, check five things that separate good tool users from great ones:
- Fit with the role's data: Can they work with the data formats you have, from warehouse tables to spreadsheets and text?
- Speed of learning: How quickly do they pick up a feature they have not used? Ask how they would learn a new tool in their first month.
- Integration and compatibility: Can they connect to data sources, import and export cleanly, and move work between tools without manual copying?
- Scale: Do they know what to do when a dataset is too big for a spreadsheet, and when to move the work to SQL or Python?
- Data security: Do they handle sensitive data with care, respect access controls and avoid emailing raw customer files around?
Microsoft's data analyst training path is a useful reference for the Power BI skills a working analyst is expected to have. On Testlify you can test each tool directly with the SQL test, the data analyst Excel test, the Power BI test and the Python pandas test.
How should you adapt the tips to evaluate data analysis skills by role?
Adapting the tips to evaluate data analysis skills by role means changing the depth and mix of tests, not the method. Junior analysts need solid basics and good habits; senior analysts need judgment and influence; business roles that use data need interpretation more than code.
Role | Focus the assessment on | Lighter on |
|---|---|---|
Junior data analyst | Excel or SQL basics, data cleaning, clear charts | Advanced statistics, modeling |
Senior data analyst | Problem framing, statistics scenarios, presenting to leaders | Basic tool trivia |
Marketing, finance or operations analyst | Data interpretation, spreadsheets, domain metrics | Python or R |
Data quality analyst | Validation, anomaly detection, data lineage | Dashboard design |
Pay is a good reason to get this right. The US Bureau of Labor Statistics Occupational Outlook Handbook puts the median pay of data scientists at $120,230 (May 2025) and projects 35% employment growth from 2025 to 2035, with about 24,800 openings a year. A wrong hire at that level is expensive.
For data quality roles, pair these tips with targeted data quality analyst interview questions. For the full hiring process, see these best practices for hiring data analysts.
What red flags show weak data analysis skills?
Weak data analysis skills usually show up as confident numbers with no checks behind them. Watch for candidates who skip data validation, cannot explain why they chose a method, or describe tools instead of decisions.
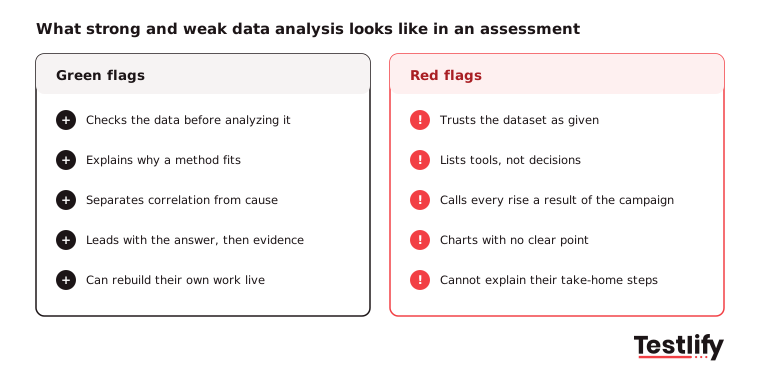
During recruitment, watch for these common red flags that may indicate a candidate lacks practical data analysis skills:
- Tool lists without trade-offs: They name ten tools but cannot say when SQL beats a spreadsheet.
- No data checks: They accept the dataset as given and never mention missing values or outliers.
- Correlation treated as cause: "Sales rose after the campaign, so the campaign worked."
- Charts without a point: Dashboards full of visuals, but no answer to the question asked.
- Jargon with non-analysts: They cannot explain the finding to a hiring manager in plain words.
- Results they cannot reproduce: In a live follow-up they cannot walk through their own take-home steps.
The last one matters more now that AI assistants can write SQL and summaries. Asking candidates to explain or extend their own work live is the simplest check.
How does Testlify help you evaluate data analysis skills?
Testlify helps hiring teams evaluate data analysis skills with ready-made tests, hands-on tasks and scored results in one place.
- Ready-made tests: 3,500+ tests, including the data analyst test, data interpretation, SQL, Excel, Power BI, Tableau, statistics and critical thinking, at beginner to advanced levels.
- Real work samples: 25+ question types, including coding in 45+ programming languages, Excel and Google Sheets tasks, file uploads and open-ended answers for written analysis.
- Fair, comparable scores: Automated scoring, weighted scoring, benchmarking and AI candidate insights with a per-skill breakdown.
- Integrity checks: 20+ proctoring checks, including AI assistance detection and copy and paste tracking. See anti-cheating and proctoring.
- Fits your stack: 100+ ATS and HRIS integrations, including Workday, Greenhouse and Lever.
Ready to test data analysis skills on your next hire?
Pick the data analysis, SQL and data interpretation tests from the Testlify test library, add a short work sample, and send it to your next applicants. Start a 7-day free trial, no credit card required, or book a demo to see it on your own role.
Frequently asked questions (FAQs)

Co-Founder and CTO
Jiten Modi is Testlify's CTO and leads a 50-person engineering organization. He writes on technical hiring, evaluating developers with real-world assessments, and building engineering teams.
LinkedInRelated resources
View all
HR & recruitment
5 tips to evaluate customer service skills

HR & recruitment
How to evaluate problem-solving skills in candidates

HR & recruitment
10 Key computer skills to assess during job interviews

HR & recruitment
Computer skills tests in hiring: what to test and why

HR & recruitment
How to assess financial modeling skills when hiring

HR & recruitment
How to evaluate leadership skills: methods, questions and a scorecard
Get started.
Hire on proof, not resumes.
Run your first skills-based assessment free — no credit card required.