
Revenue per FTE: Formula, Benchmarks, and How to Improve It
Discover how businesses can optimize workforce productivity and boost profitability using Revenue per FTE. Learn practical strategies, challenges, and data-driven solutions.

Two companies can report the exact same $20 million in revenue, yet one can be far more profitable and efficient than the other. One achieves it with just 90 people. The other needs 200. That gap, the revenue each full-time worker actually produces, is exactly what revenue per FTE measures, and it’s one of the fastest ways to see whether your headcount is paying for itself.
Most HR and finance teams track it once a year, shrug at the number, and move on. That is a miss. Read on and you will know how to calculate revenue per FTE correctly, what a strong number looks like by industry, the mistakes that quietly distort it, and the one lever HR controls that moves it more than any spreadsheet tweak: who you hire.
Revenue per FTE is your total revenue divided by the number of full-time equivalent employees, and it shows how much income each full-time role generates over a set period.
 ChatGPT
 Gemini
 Claude
 Grok
Grok Perplexity
TL;DR
- Revenue per FTE = total revenue / number of full-time equivalents. It measures workforce productivity, not headcount.
- Convert part-timers to FTEs first (their weekly hours / a full-time week), or the number lies.
- A “good” number is industry-specific. Private SaaS runs a median near $129,724 per employee; capital-heavy sectors run far higher for reasons that have nothing to do with people.
- Compare against your own trend and close peers, never a cross-industry average.
- The biggest HR lever is quality of hire. Better-matched hires raise output per person; weak hires drag the whole ratio down.

What is revenue per FTE?
Revenue per FTE is a productivity metric that divides a company’s total revenue by its number of full-time equivalent employees over a set period. It answers a simple question: for every full-time role you pay for, how much revenue comes back? A rising number means the team is producing more per person. A falling one means headcount is growing faster than output.
What counts as a full-time equivalent?
A full-time equivalent (FTE) standardizes a mixed workforce into one unit. One full-timer is 1.0 FTE. Two people who each work half a full week add up to 1.0 FTE, not 2.0. Counting raw headcount instead of FTEs is the most common way this metric gets inflated, because part-time and shared roles get counted as if they were full workloads.
Revenue per FTE vs revenue per employee
The two terms get used as if they mean the same thing. They don’t. Revenue per employee divides revenue by a raw headcount, so a company with lots of part-timers looks less productive than it is. Revenue per FTE first converts everyone to full-time equivalents, so the denominator reflects actual labor capacity. For any business with part-time, seasonal, or shared roles, revenue per FTE is the more honest figure. This guide uses the FTE version throughout.
How is revenue per FTE calculated?
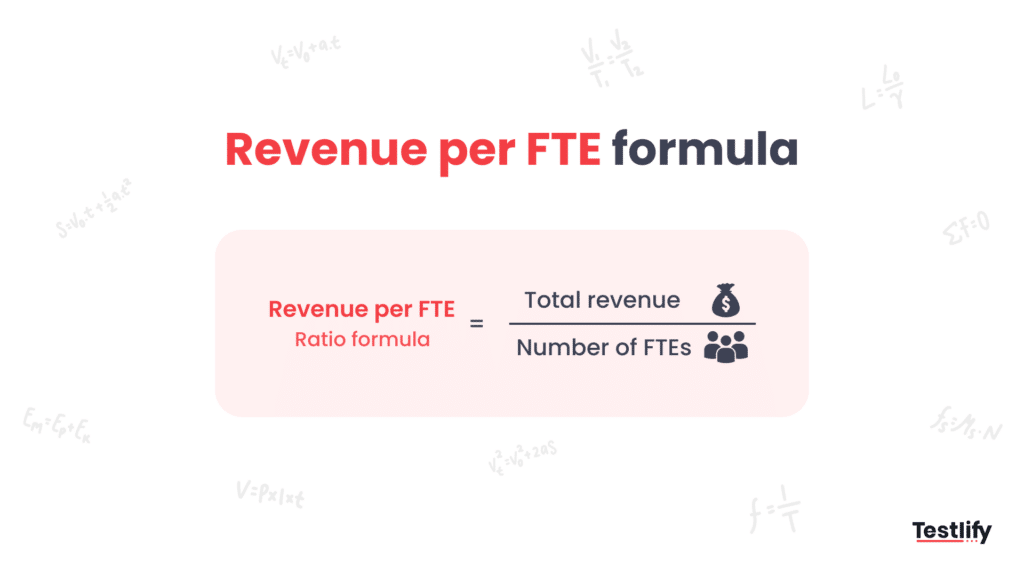
To calculate revenue per FTE, divide total revenue for a period by the number of full-time equivalents in that same period. The formula is short; the accuracy lives in how carefully you count the FTEs.
Revenue per FTE = total revenue / number of FTEs
Step by step
- Pick one period and one revenue figure. Use the same window (a quarter or a fiscal year) for both revenue and headcount. Decide upfront whether you are using gross revenue or net, and keep it consistent every time you measure.
- Convert everyone to FTEs. Full-timers count as 1.0. For each part-timer, divide their weekly hours by a standard full-time week (usually 40). Add the results to your full-time count.
- Divide. Total revenue divided by total FTEs gives you revenue per FTE for the period.
A worked example
Take a managed IT services firm that booked $20 million in annual revenue. It employs 110 full-time staff plus 20 part-timers who each work 20 hours a week. First, convert the part-timers: 20 people at 20 hours, divided by a 40-hour week, equals 10 FTEs. Total FTEs come to 120. So revenue per FTE is $20,000,000 / 120, which is about $166,667 per FTE.
Had the same firm used raw headcount (130 people) instead of FTEs, the number would drop to roughly $153,846, understating how productive the team really is by about $13,000 per head. Same revenue, same people, very different story, purely because of how the denominator was counted.
What is a good revenue per FTE benchmark?
A good revenue per FTE depends almost entirely on your industry and business model, so there is no single target. Software companies run high because code scales without adding people. Labor-intensive and services businesses run lower. The most reliable benchmark is your own number over time, compared against a handful of close competitors.
For SaaS companies, recent industry data provides a useful reference point:
Business type | Revenue per employee | Source |
|---|---|---|
Private SaaS (median) | $129,724 | SaaS Capital 2025 survey of 1,000+ companies |
Public SaaS (median) | $283,000 | SaaS Capital 2025 |
Outside SaaS, revenue per employee differs significantly based on how much a business relies on people versus technology or physical assets. As a general planning guideline:
Business type | Typical revenue per employee |
|---|---|
Professional & managed services | $150,000–$250,000 |
Capital-intensive industries (banking, energy, utilities) | $400,000+ |
Rather than aiming for an arbitrary number, track your revenue per FTE over time and compare it with companies in your industry. An improving trend often tells you more about operational efficiency than a single benchmark because hiring strategy, automation, pricing, and business maturity all influence the metric.
How to interpret your revenue per FTE trend
One quarter tells you almost nothing. Judge revenue per FTE over at least four quarters, using trailing twelve-month revenue so seasonality and one-off deals do not swing the read. What you are looking for is the relationship between two lines: revenue growth and revenue per FTE.
Three patterns cover most companies:
Both rising. You are scaling well. Each new hire is adding at least as much output as the ones before. Keep the hiring bar where it is.
Revenue rising, revenue per FTE flat or falling. You are buying growth with headcount rather than getting more from each role. A quarter or two of this is normal during a hiring push, because new hires take three to six months to reach full output. If the gap persists past that ramp window, the problem is usually one of three things: roles that were scoped wrong, tools and processes that cap output, or recent hires who were not the right fit. Check them in that order, since the first two are cheaper to fix.
Both falling. This is a revenue problem, not a productivity problem. Cutting headcount to rescue the ratio treats the symptom.
Pro tip: Plot revenue per FTE and revenue growth on the same chart, and mark the quarters where you added significant headcount. If revenue per FTE has not recovered within two quarters of a hiring wave, that cohort of hires is your first place to look. That is the moment to audit hiring quality for those roles, not to freeze headcount across the board.
Why does revenue per FTE matter?
Revenue per FTE matters because it turns a vague sense of “are we productive?” into a number you can track, compare, and plan against. It sits at the join between finance and people decisions, which is exactly where a lot of scaling mistakes happen.
It exposes real productivity
Headcount and hours measure input. Revenue per FTE measures output. The link between the two is strong: Gallup’s Q12 meta-analysis found that the most engaged business units run 23% higher profitability and 18% higher productivity in sales than the least engaged, per Gallup. Productivity gains show up at the national level too: U.S. nonfarm business productivity rose 2.0% from the fourth quarter of 2023 to the fourth quarter of 2024, reports the U.S. Bureau of Labor Statistics. Revenue per FTE is how you see that same effect inside your own walls.
It sharpens hiring and budget decisions
Before you approve a new team, the metric forces a useful question: will this hire hold or raise revenue per FTE, or just add cost? It also guides where to invest. A department well above the company average is worth studying and copying; one well below may need better tools, clearer roles, or a look at recent hiring. For a full picture, pair it with your direct and indirect hiring costs so you see both what people produce and what they cost to bring on.
How does hiring quality change revenue per FTE?
Here is the part most finance-led guides skip. Revenue per FTE is a ratio, and HR owns the denominator. Every hire you add changes it. A strong hire lifts output per person; a poor-fit hire adds a full FTE to the bottom of the fraction while contributing far less than one, which drags the whole number down for months.
Six factors shape revenue per FTE: industry dynamics, workforce composition, business model, skillset and expertise, employee engagement, and tech adoption. Some of these are fixed by the market you operate in. Others sit squarely within your control, and knowing which is which tells you where to focus.
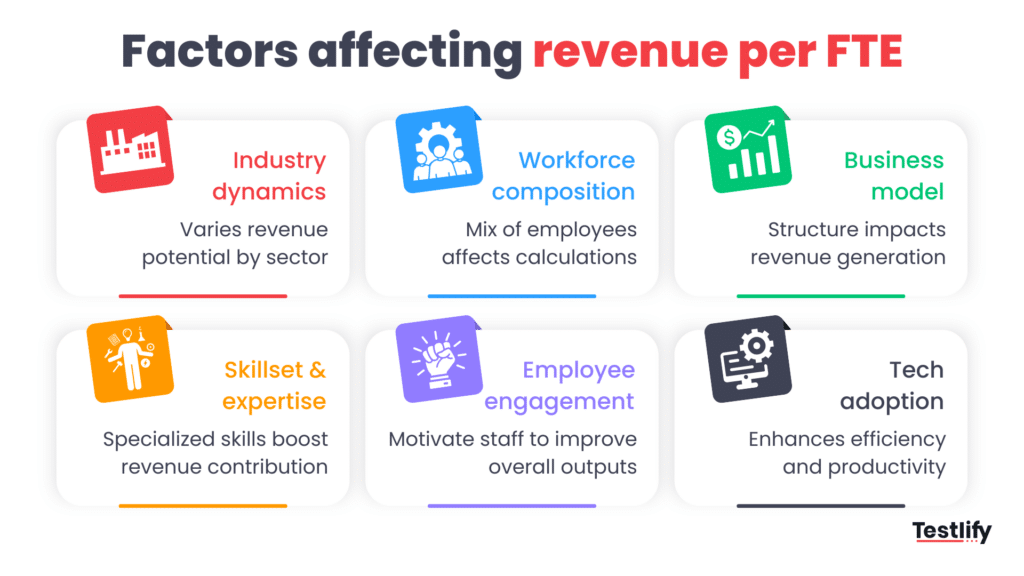
1. Industry dynamics Some industries simply start with higher revenue per person. Capital-heavy sectors like energy or banking post big numbers because machines, assets, and money do a lot of the heavy lifting. Labor-intensive businesses (think services or retail) naturally run lower. This is why comparing yourself to a completely different industry is pointless — it tells you nothing useful.
2. Workforce composition Full-time, part-time, seasonal, or contractors — how you structure and count your people directly affects the number. Two companies with the same revenue and same total hours worked can show very different results just because of how they calculate their denominator. Count part-timers as full heads and you’ll accidentally make your team look less productive than they really are.
3. Business model This one sets the ceiling. A SaaS or product company can grow revenue much faster than headcount because the same code or product serves more customers. A services business ties revenue closely to people hours, so the two tend to move together. No matter how well you execute, you probably won’t turn a consultancy’s ratio into a SaaS one.
4. Skillset and expertise The right skills in the right roles make a massive difference. But here’s the catch: skills get outdated fast. The World Economic Forum estimates that 44% of core workplace skills will be disrupted by 2027. Hire against yesterday’s job description and you build a productivity gap into your ratio from day one.
5. Employee engagement Engaged people simply produce more. According to Gallup’s research, the most engaged teams deliver 23% higher profitability than disengaged ones. Same headcount, same tools — just more output because people are bringing more of themselves to the work.
6. Tech adoption Good tools and smart automation let each person accomplish more. When you remove repetitive work, the numerator (revenue) goes up without increasing the denominator (headcount). This is often one of the fastest ways to move the needle — though it comes with real costs and the risk of automating the wrong things.
How can you improve revenue per FTE?
You can improve revenue per FTE two ways: grow revenue without adding proportional headcount, or get more output from the people you already have. The tactics below focus on the levers HR and People Ops actually control, in rough order of impact.
Hire for demonstrated skill, not credentials
This is the highest-impact move because it compounds. A hire who can do the job on day one reaches full output faster and needs less rework from the team around them. Screen with role-relevant assessments before the first interview so the shortlist is already scored on ability, not just on how a resume reads. The tradeoff: building good assessments takes upfront effort, and a badly designed test screens out strong people. Start with the two or three competencies that most predict on-the-job performance.
Automate the low-value work, keep the judgment
Every hour a skilled employee spends on repetitive admin is revenue not earned. Automating data entry, scheduling, and routine reporting frees people for work only they can do. The caveat is real: automation has setup and maintenance costs, and over-automating customer-facing steps can cost you more in trust than it saves in time. Automate the boring middle, not the human edges.
Invest in the skills that move revenue
Targeted training beats generic learning budgets. Use HR analytics to find where output per person lags, then train for that specific gap rather than spreading a course library thin. A sales team that closes 10% faster after focused coaching moves revenue per FTE more than a company-wide seminar nobody applies.
Fix retention before you fix recruiting
Every experienced person who leaves takes productivity with them and resets a new hire’s ramp clock. Keeping strong performers, through fair pay, real growth paths, and manageable workloads, protects the output side of the ratio. Replacing a productive employee almost always costs more than keeping one, and the new hire runs below full speed for months.
What distorts revenue per FTE?
Revenue per FTE is only as trustworthy as the inputs behind it. A few recurring errors make the number look better or worse than reality, and every one of them is avoidable.
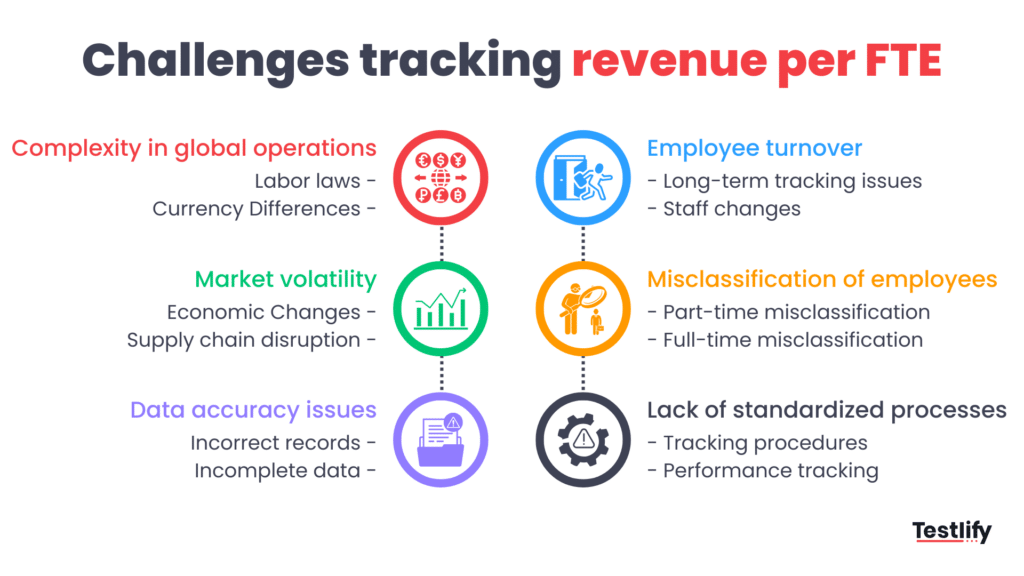
- Counting headcount instead of FTEs. Part-timers counted as full roles inflate the denominator and understate productivity. Convert to FTEs first, every time.
- Mixing gross and net revenue. Switching revenue definitions between periods makes a flat trend look like growth or decline. Pick one and hold it.
- Comparing across industries. A services firm measured against a software company will always look weak. Compare only against similar business models.
- Ignoring contractors. If contractors do work that drives the revenue in your numerator, leaving them out of the denominator overstates how lean you are.
- Reading one quarter as a trend. Seasonality and one-off deals swing a single period. Judge the metric over four quarters or more.
Hire for output, not just headcount
The fastest way to raise revenue per FTE is to stop letting the wrong hires enter the ratio. Score candidates on the skills the role needs now, before the first interview, and your shortlist is already weighted toward the people who will lift output per role. That is where Testlify fits: role-based skills assessments and structured evaluation that make quality of hire measurable.
See how better hiring improves revenue per FTE. Build a role-specific skills assessment in minutes and evaluate candidates based on real job skills—not just resumes. Start free with Testlify, or book a demo to learn how skills-based hiring helps teams become more productive and efficient.
Key takeaways
- It measures productivity, not size. Revenue per FTE tells you how much each full-time role produces, so a smaller, sharper team can outscore a larger one on the same revenue.
- Count FTEs, not heads. Convert part-time and shared roles to full-time equivalents before you divide, or the metric overstates your team and understates its output.
- Benchmarks are industry-bound. Private SaaS medians near $129,724 per employee mean nothing to a services firm. Compare against your own trend and close peers, not a cross-industry average.
- The trend beats the snapshot. If revenue per FTE flattens while headcount grows, each new hire is adding less. That divergence is your early warning to check hiring quality.
- Hiring quality is the HR lever. HR owns the denominator. Skills-based hiring keeps weak-fit hires out of the ratio and raises output per role, which is why quality of hire moves this number more than cost-cutting does.
- Protect the inputs. Consistent revenue definitions, contractor accounting, and a four-quarter view keep the metric honest enough to act on.
Frequently asked questions (FAQs)

B2B SaaS Content Writer
Rishav Kumar is a B2B SaaS content writer with 4 years of experience. He loves crafting engaging content. Always exploring fresh ideas, he's passionate about helping businesses grow through impactful writing.
LinkedInRelated resources
View all
HR & recruitment
What is job restructuring and how to do it?

HR & recruitment
Cost-effective employee training solutions: using SCORM-compliant authoring tools to create E-learning courses

HR & recruitment
7 tips on recruiting students for HR professionals

HR & recruitment
HR budget 101: A comprehensive guide for 2026

HR & recruitment
16 innovative recruitment strategies in 2026
![13 most common HR issues [and solutions]](/api/media/file/13-most-common-HR-issues-and-solutions-2.png?dpl=dpl_6Z8Gzi5dgny5ePrnCfPbRPCRYCA7)
HR & recruitment
13 most common HR issues [and solutions]
Get started.
Hire on proof, not resumes.
Run your first skills-based assessment free — no credit card required.