
How to determine your recruitment KPIs in 2026
Discover a practical guide to defining recruitment KPIs that actually impact business performance in 2026

To determine your recruitment KPIs, start from the business outcome you are accountable for, pick one or two metrics that prove movement on it, then segment those metrics by role and seniority so the numbers mean something. Most teams skip that and start from a metrics list, which is how dashboards get built once and quietly abandoned by the third quarter.
 ChatGPT
 Gemini
 Claude
 Grok
Grok Perplexity
TL;DR
- Start with the business outcome, not a list of recruiting metrics. Every KPI should tell you whether hiring is helping the business achieve that outcome.
- Audit the hiring process first to find where time, candidates, or money are being lost before deciding what to measure.
- Build a focused set of 8–10 KPIs, covering speed, cost, hiring quality, retention, sourcing, and stakeholder experience.
- Track time to fill, time to hire, cost per hire, offer acceptance, quality of hire, sourcing yield, first-year retention, and hiring manager satisfaction as a practical starting set.
- Segment kpis by role, seniority, hiring type, and location so company-wide averages do not hide problem areas.
- Use industry benchmarks to sanity-check performance, not set blind targets. Your own baseline and trend should drive the target.
- Make quality of hire a core KPI by connecting pre-hire assessment data with post-hire performance and retention.
- Review the KPI framework every quarter and retire metrics that no longer influence a decision.

What is a recruiting KPI framework?
A recruiting KPI framework is the set of rules that decides which hiring metrics you track, how each one is calculated, who owns it, and when it gets reviewed or retired. It is not a dashboard. The dashboard is what a framework produces after you have agreed on what matters and why.
The difference shows up about six months in. Teams with a framework can tell you why a metric is on the screen and what decision it feeds. Teams with only a dashboard have a screen nobody opens.
Seven steps, in order:
- Define what matters to the business
- Audit your current hiring process
- Apply SMART to every metric you keep
- Segment by job type and hiring level
- Match tooling to your data maturity
- Align the stakeholders who use the numbers
- Review and retire what stopped working
What business outcome should each KPI serve?
Every recruitment KPI should trace back to something the business is actively trying to do. Before you open a spreadsheet, get honest answers from your leadership team on three questions:
- What are our growth targets for the next 12 months, and what headcount does that actually require?
- Which open roles, left unfilled for 60 or 90 days, would genuinely slow the business down?
- Are we in acquisition mode, stabilization mode, or transformation mode right now?
Those answers set your priorities. A company scaling hard needs time to fill and source-of-hire tracked tightly. A company bleeding people in year one needs quality of hire and first-year retention, and time to fill barely matters by comparison.
The cost of getting this wrong is not abstract. Gallup puts the cost of replacing an employee at one-half to two times salary, and around 200% for leaders and managers. So a KPI set that optimizes for speed while quality slides is not a neutral tradeoff. It is an expensive one, paid later, out of a different budget.
How do you audit a hiring process before setting KPIs?
Walk the whole thing, from requisition approval to first-day onboarding, and record where time and candidates actually go. You cannot improve what you have not measured, and you cannot measure what you have not mapped. At each stage, ask:
- Where do candidates drop off most often?
- Which stages consistently take longest, and why?
- Where do hiring managers express the most frustration?
- Which roles or locations take longer to fill, and what do they have in common?
You will almost certainly find the real friction is not what leadership believes. A company convinced its sourcing is weak often turns out to have hiring managers who take five days to review a shortlist. Another, sure that candidates reject offers over pay, finds that declined-candidate feedback keeps naming a slow, impersonal interview loop.
Some of that pressure is market-wide rather than yours. The U.S. Bureau of Labor Statistics counted 7.3 million job openings against 5.1 million hires in July 2026, with 3.1 million quits in the same month. Knowing the baseline churn in your market stops you from writing a retention KPI that treats ordinary turnover as a crisis.
A practical audit template to work through:
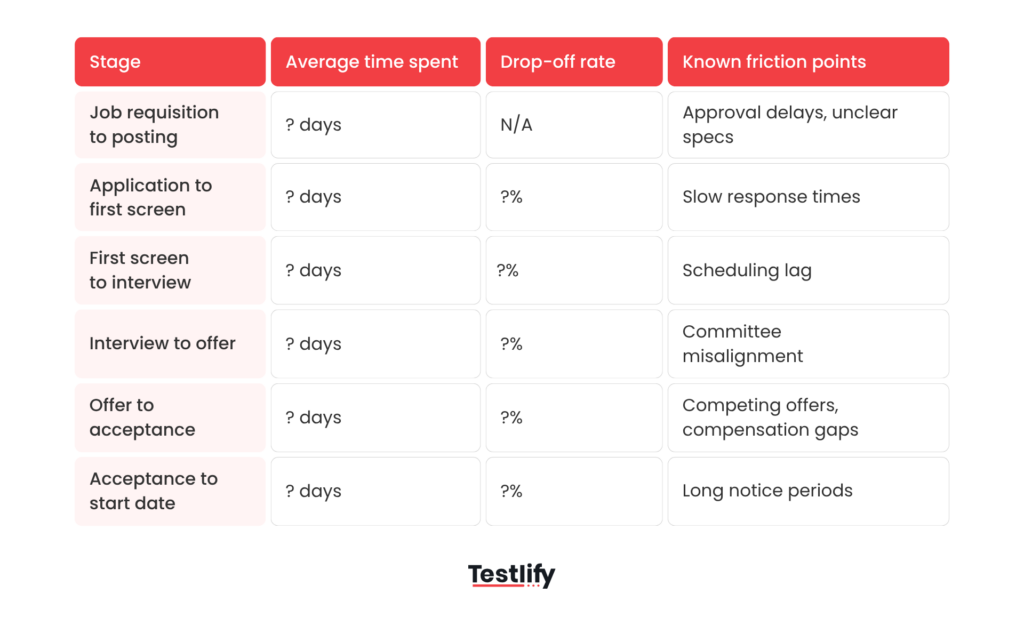
Fill it in with your own data, not your impressions. The gap between the two is where your first KPIs belong. If you have never timed the stages, start with how long hiring should take and measure against that before setting a target.
Does every KPI need to be SMART?
Yes, and all five criteria, not the three that are easy. A metric that fails even one of them becomes the number somebody argues about in a meeting instead of acting on.
- Specific: "Improve hiring" is a wish. "Reduce average time to fill for engineering roles from 62 days to 45 days by Q3" is a KPI.
- Measurable: can you capture this consistently without manual heroics? A metric you can only estimate is one you will stop tracking within a quarter.
- Achievable: set targets from your own historical data. Industry averages are context; your trajectory is the benchmark that matters.
- Relevant: if you cannot explain in one sentence why it matters to someone in finance or operations, it does not belong on the dashboard.
- Time-bound: every KPI needs a deadline. Quarterly is the floor. Operational metrics like time to fill and offer acceptance need a monthly look, or you find out too late to fix anything.
Pro tip: write the calculation down, in words, next to every KPI, and get one named owner to sign off on it. Half the KPI arguments in a quarterly review are not disagreements about performance. They are two people using the same word for two different formulas, usually time to fill versus time to hire.
The best recruitment KPIs to track in 2025 and 2026
There is no universal set, but there is a defensible starting eight. Each one answers a question a business leader actually asks, and each has a calculation you can defend in a review. For the full definitions behind these, see our recruitment KPI definitions.
KPI | What it actually tells you | How to calculate | Review cadence |
|---|---|---|---|
Time to fill | Whether your process and approvals keep pace with demand | Days from requisition approved to offer accepted | Monthly |
Time to hire | Candidate-side friction, once someone is in your pipeline | Days from candidate entering pipeline to offer accepted | Monthly |
Cost per hire | What a hire really costs once internal time is counted | (Internal costs + external costs) divided by hires in the period | Quarterly |
Offer acceptance rate | Whether your close, pay and candidate experience hold up | Offers accepted divided by offers extended | Monthly |
Quality of hire | Whether the people you pick actually perform | Blend of 6 to 12 month performance rating, ramp time and retention | Quarterly |
Sourcing channel yield | Which channels produce hires, not just applicants | Hires from a channel divided by candidates that channel sent | Quarterly |
First-year retention | Whether the hire and the role were honestly matched | New hires still employed at 12 months divided by new hires | Quarterly |
Hiring manager satisfaction | Whether recruiting is trusted by the people it serves | Post-hire survey score, captured per requisition | Quarterly |
Cost per hire has a standard definition worth using rather than inventing: the ANSI and SHRM standard formula adds internal and external recruiting costs and divides by hires in the period. Use it as published, because a homemade version cannot be compared to anything, including your own numbers from last year.
Quality of hire is the one that separates a real framework from a pipeline report, and it is the hardest to stand up, because it needs data from after the hire. That is the loop behind the Testlify Quality-of-Hire Learning Model: define success criteria, assess against the competencies the role needs, hire on structured evidence, then compare the pre-hire signals with what actually happened at six and twelve months, and reweight what you measure next time.
Which pre-hire signals are worth putting in that loop is a question selection science has answered, and recently revised. A 2022 reanalysis in the Journal of Applied Psychology by Sackett and colleagues corrected decades of range-restriction overcorrection and reordered the predictors. Under the revised validity estimates, structured interviews, job knowledge tests and work samples all rank ahead of general cognitive ability, which had held the top spot for years. The exact coefficients are still contested in print, so do not build a target on any single number. The ordering is the part that survives every reanalysis, and it tells you which signals deserve to feed a quality-of-hire KPI.
How should you segment recruitment KPIs?
A single company-wide dashboard is almost always misleading. Time to fill for a senior engineer in a tight market looks nothing like time to fill for a support representative. Offer acceptance for an executive is driven by different forces than for a graduate analyst. Averaging them tells you nothing you can act on.
Segment by:
- Job family: engineering, sales, operations, creative
- Seniority: entry, mid, senior, executive
- Hiring type: permanent, contract, seasonal
- Geography or business unit: different labor markets, different benchmarks
A team hiring in both Bangalore and London should track cost per hire separately, because the sourcing channels and competitive dynamics are not comparable. Here is how segmented targets might look for a mid-market company:
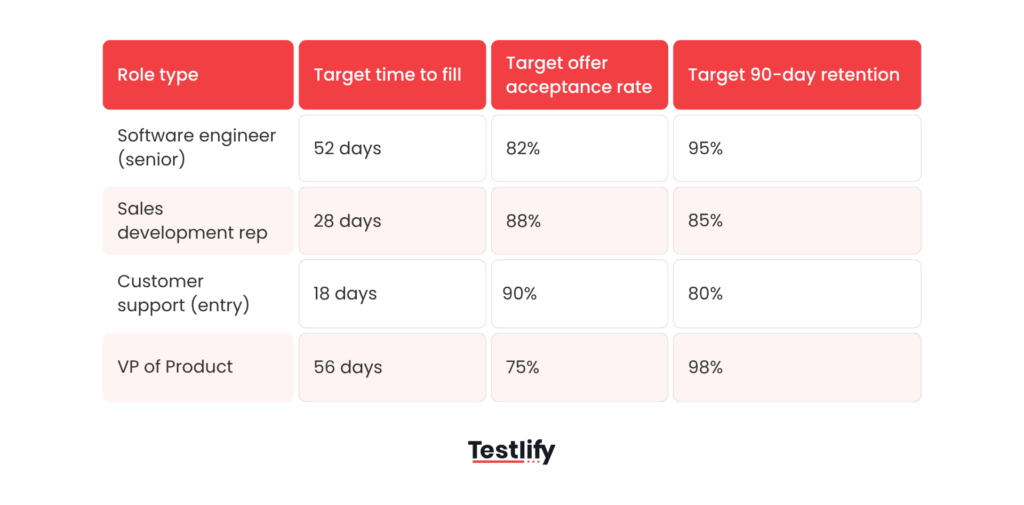
Retention KPIs need the same treatment, and the public data shows why. BLS put median employee tenure at 3.9 years in January 2024, down from 4.1 years in 2022 and the lowest since 2002. Underneath that average, the spread is wide:
Sector | Median employee tenure, January 2024 |
|---|---|
All wage and salary workers | 3.9 years |
Public sector | 6.2 years |
Private sector | 3.5 years |
Mining, quarrying, oil and gas | 5.7 years |
Manufacturing | 4.9 years |
Financial activities | 4.7 years |
Leisure and hospitality | 2.1 years |
Nearly three times the tenure in mining as in hospitality. A single first-year retention target across a mixed workforce would flag a perfectly healthy hospitality operation as failing, and let an underperforming manufacturing team look fine. Segmentation is what separates teams who understand their data from teams who report it.
Which analytics tools do you actually need?
Fewer than the market wants to sell you. The right tool is the one your team will use consistently, at the maturity you are actually at, not the one built for the company you hope to be.
Early-stage analytics teams usually find a well-configured ATS with solid built-in reporting covers most of what they need. Pulling data across several systems is the point at which a reporting layer starts to pay for itself, mostly because it lets you connect a sourcing channel to six-month retention instead of stopping at the offer. Larger teams with clean data infrastructure can reasonably look at predictive signals, though that is the last step, not the first.
Three principles hold at every size:
- Do not buy analytics infrastructure before you have clean, consistent data to feed it.
- Automate capture at the source. Manual reporting introduces both lag and error, and the error is the worse of the two.
- Prefer role-based views, so each stakeholder sees the data their decisions need rather than the whole warehouse.
Be honest about the sequencing here. Buying a reporting layer to fix a data problem is a well-worn and expensive mistake. The tool renders whatever it is given, and a dashboard built on inconsistent stage definitions produces confident, wrong answers faster than a spreadsheet would.
How do you get stakeholders to use the numbers?
KPIs that live only inside HR are KPIs that get ignored in budget and headcount conversations. The teams that get traction share data openly with hiring managers, business unit leaders and the executive team, and they match the level of detail to the audience rather than sending everyone the same report.
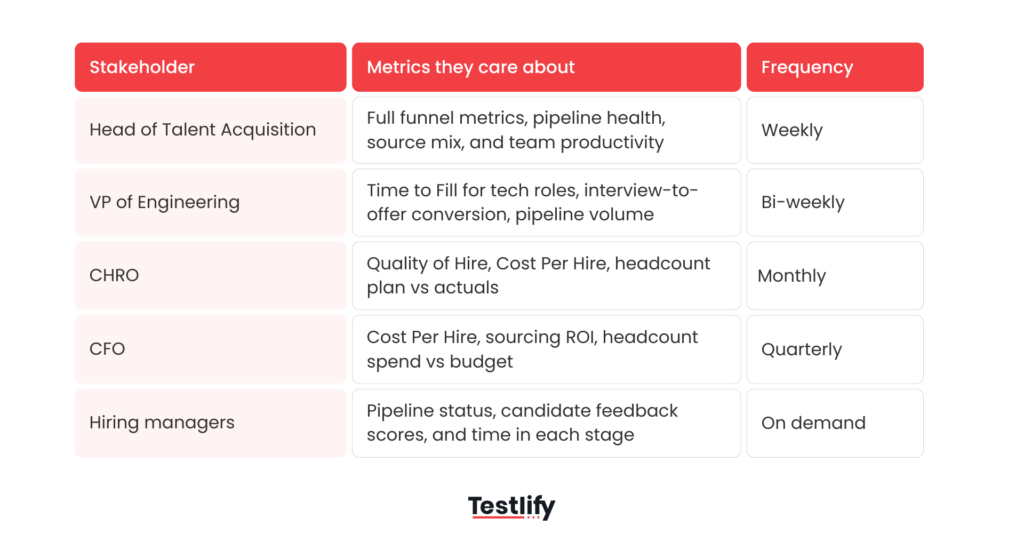
The step most teams skip is a shared service-level agreement between recruiting and hiring managers. Once both sides agree on response times, interview completion and decision deadlines, a missed target stops being a recruiting failure and becomes a shared one. That single change does more for KPI adoption than any dashboard redesign.
Take a worked example, hypothetical but ordinary. Say a 120-person creative agency is hiring three account directors, and its time to fill reads 71 days, well past target. Split by stage, 24 of those days sit between final interview and decision, on the client-services director's desk. No sourcing change fixes that. An SLA with a five-day decision window does, and the KPI that actually needed watching was decision latency, not time to fill. Pair KPI performance with business outcomes in a quarterly review, and connect it to strategic talent planning rather than presenting activity metrics in isolation.
When should you retire a KPI?
When it has not changed a decision in 90 days. Most teams review the numbers inside the framework diligently and never review whether the framework still fits. Business priorities move, leadership changes, markets shift. A metric set that was right 12 months ago can be measuring last year's problem.
Every quarter, ask your team four questions about each metric:
- Is this still relevant given how the business has changed?
- Can our team actually influence this number?
- Are we spending more time collecting it than acting on it?
- Has it driven a meaningful decision in the last 90 days?
If the last answer is no, cut it. A lean set of 8 to 10 metrics your team owns completely beats a 30-metric report nobody acts on.
The skills being hired for are moving underneath you too, which is the real argument for a scheduled review. The World Economic Forum's Future of Jobs 2025 found employers expect 39% of core skills to change by 2030, down from 44% in its 2023 edition. When the definition of a qualified candidate shifts that much, a quality-of-hire measure built on last year's competency model quietly stops measuring quality.
Ready to put real evidence behind your KPIs?
Setting the right KPIs is half the work. The other half is having assessment data solid enough that quality of hire is a measurement rather than an opinion.
Testlify gives talent teams the pre-hire evidence that a quality-of-hire KPI needs: role-based skills, cognitive and personality assessments, structured and AI-assisted interviews, percentile benchmarking and candidate ranking, reviewer scoring with human override, and CSV or PDF exports of score logs that feed whatever you report in. It integrates with more than 100 ATS and HR systems, so results land in the system your team already runs.
If you are building a measurement-led recruiting function, book a demo and see what the data behind a quality-of-hire KPI looks like.
Frequently asked questions (FAQs)

Related resources
View all
HR & recruitment
The ultimate guide to recruitment KPIs

HR & recruitment
Why traditional sources of recruitment are failing modern employers?

HR & recruitment
Top 12 sources of recruitment for hiring top talent

HR & recruitment
Sources of recruitment checklist for high-growth companies

HR & recruitment
Best tools to track sources of recruitment

HR & recruitment
How to choose the right sources of recruitment
Get started.
Hire on proof, not resumes.
Run your first skills-based assessment free — no credit card required.