
Data-Driven Recruitment: A Complete Guide for Enterprise Teams (2026)
Discover how Testlify’s analytics tools provide actionable data to help HR teams reduce bias, improve hiring decisions, and revolutionize recruitment.

Data-driven recruitment replaces subjective judgment with measurable evidence. Recruiting teams collect data on candidate skills, funnel conversion rates, and post-hire performance to make consistent, auditable hiring decisions. This guide covers the key metrics, how to build a working program step by step, and how assessment analytics connect scores to decisions at enterprise scale.
TL;DR
- Enterprise teams using skills assessments before first-round interviews cut time-to-hire by up to 55%. The assessment does qualification work the interview should not have to repeat.
- Quality of hire, measured as first-year performance and manager satisfaction, separates strong data-driven programs from weak ones; teams that track it fill roles that last.
- SHRM’s 2025 benchmarking report puts the average cost per hire at $4,129 and median time-to-fill at 42 days. Every re-opened search compounds both figures.
- Start with three metrics before adding more: source of hire, assessment pass rate, and quality of hire. Track a few well rather than a dashboard no one reads.
- Data-driven recruitment narrows the field; a human still makes the final call. The data makes that call defensible, consistent, and auditable.
- 94% of candidates who complete a Testlify assessment report a positive experience, meaning structured screening does not have to erode employer brand.
- Testlify integrates with 100+ ATS tools, so assessment scores flow directly into the system the recruiting team already uses rather than creating a separate workflow.
 ChatGPT
 Gemini
 Claude
 Grok
Grok Perplexity
What is data-driven recruitment?
Data-driven recruitment uses measured data, specifically candidate skills assessment scores, funnel conversion rates, and post-hire performance records, to determine who advances at each stage of hiring. Rather than relying on impressions from a resume or an unstructured conversation, the team sets a measurable standard before reviewing any candidate and evaluates everyone against it the same way.
This approach connects directly to skills-based hiring, where demonstrated ability replaces credentials as the primary qualification. LinkedIn’s Economic Graph research found that taking a skills-first approach expands the qualified talent pool by up to 10 times for many roles, opening access to candidates a resume filter would remove before a human ever saw them.
The core difference from traditional hiring is the decision-making sequence. In a data-driven program, the hiring manager reviews evidence first: scores, benchmarks, and gap reports. The interview then tests what a score cannot capture. Without that sequence, the interview carries the full weight of the decision, and it was never designed to do that alone.

Why does data-driven recruitment matter for enterprises?
Because unstructured, impression-based hiring is one of the weakest predictors of job performance available to recruiting teams. Decades of selection research show that structured, scored assessments predict on-the-job performance significantly better than resumes or unstructured conversations, and that gap costs enterprise teams real money at scale.
Schmidt, Oh and Shaffer’s analysis of 100 years of selection research (2016) found that general mental ability tests are the single strongest predictor of job performance, with an operational validity of about 0.65, where 1.0 is a perfect predictor. Structured interviews add far more predictive power on top of a cognitive test than unstructured ones do, an 18 percent lift versus 13 percent, because every candidate faces the same questions, graded the same way.
The business case sharpens at scale. SHRM’s 2025 recruiting benchmarking report puts the median time-to-fill at 42 days, with the average cost per hire at $4,129. For an organization running 500 or more hires per year, a 10% reduction in re-opened searches translates to hundreds of thousands of dollars in direct recruiting costs. Add the productivity cost of an empty role and the onboarding cost of a wrong hire, and the ROI case for structured, data-supported screening is measurable.
Dimension | Gut-feel hiring | Data-driven recruitment |
|---|---|---|
Basis of the decision | Resume, rapport, first impression | Skills scores and clear benchmarks |
Consistency | Varies by interviewer and mood | Same questions, same scoring for everyone |
Bias risk | High, hard to spot or audit | Lower, and the scoring leaves a trail |
Predicts performance | Adds little on top of a cognitive test (about a 13 percent lift) | Adds more on top of a cognitive test (about an 18 percent lift) |
Defensibility | “I had a good feeling” | A score you can show the candidate |
Pro Tip: Don’t try to measure everything at once. Pick the two or three skills that actually separate a strong hire from an average one for this specific role, score those hard, and leave the nice-to-haves for the interview. A focused assessment beats a long one nobody finishes.
What metrics does a data-driven recruitment program track?
The most effective programs track metrics across three dimensions: pipeline efficiency (how fast and cost-effectively roles fill), candidate quality (how well hires perform after joining), and process consistency (whether the same measurable standards apply at every stage). The eight metrics below cover all three dimensions and connect assessment data to business outcomes.
Metric | What it measures | Why it matters |
|---|---|---|
Quality of hire | First-year performance ratings and 12-month retention | The ultimate measure. Fast fill means nothing if the hire leaves at 10 months. |
Time-to-fill | Days from requisition open to offer accepted | SHRM 2025 median: 42 days. Track by role level to spot pipeline bottlenecks. |
Time-to-hire | Days from first candidate contact to offer accepted | More within recruiting control than time-to-fill. Tracks internal process speed. |
Cost per hire | Total recruiting spend divided by number of hires made | SHRM 2025 average: $4,129. Multiply by re-hire rate for true cost. |
Source of hire | Which channels produce the most hires | Track by quality, not volume. A low-cost source producing poor performers costs more than it saves. |
Assessment pass rate | % of candidates meeting the defined skills benchmark | Calibrate to 20-40% for most roles. Above 80% means the bar is too low. |
Application-to-interview conversion | % of applicants advancing past initial screening | Benchmark: 8-12% for structured pipelines. Below 5% signals a sourcing problem. |
Offer acceptance rate | % of extended offers accepted by candidates | Target 85%+ for well-calibrated roles. Below 70% points to compensation or process friction. |
Bottom line: More metrics do not produce better hiring. Teams that track eight metrics consistently outperform teams that track twenty metrics inconsistently. Build the measurement habit on one role type with three metrics before expanding it across the full program.
How do you build a data-driven recruitment process?
Building a data-driven recruitment process requires five connected steps: defining a measurable skills standard before the role opens, assessing candidates at the top of the funnel before any call, tracking conversion data at every stage, logging cost and time by source, and connecting post-hire performance back to the pre-hire scores that predicted it.
Testlify’s 5-Signal Hiring Model breaks that process into stages where data either informs the next action or flags a gap to address:
Signal 1: Define the skills standard before opening the role. Decide which two or three skills actually predict success in this position. Set the passing benchmark before reviewing a single application, so the standard cannot shift based on who applies.
Signal 2: Assess the full pool before the first call. Score every applicant on the defined skills using a standardized test. This narrows the shortlist to candidates who can already do the work, so interview time goes to judgment and fit rather than basic qualification.
Signal 3: Track funnel conversion at every stage. Record how many candidates move from application to assessment, assessment to interview, interview to offer, and offer to acceptance. A stage with high drop-off has either a process problem or a sourcing problem; the data shows which.
Signal 4: Record cost and time data by source and role. Not all sourcing channels produce equivalent-quality hires. Tracking cost-per-qualified-candidate, not just cost-per-hire, reveals which channels are actually worth the budget allocation.
Signal 5: Connect post-hire performance back to pre-hire scores. At the 90-day and 12-month review, compare employee performance ratings to their original assessment scores. This loop validates the assessment design and shows where the model needs recalibration.
This is the core of how analytics sharpens hiring decisions: the data is only useful when it changes what the team does next.
What does data-driven recruitment look like in practice?
In practice, data-driven recruitment changes the sequence of the hiring funnel. Skills assessment happens before the first recruiter call, not after it. The hiring manager reviews a ranked shortlist based on objective scores before any conversation has occurred. Every decision has a documented reason tied to a measurable standard, not a memory of how a conversation felt.
Consider a technology company with 400 open engineering roles per year and a previous interview-to-offer ratio of 8:1. Without structured upfront assessment, recruiters spent the majority of their capacity on screening conversations that confirmed what a skills test would have shown in 30 minutes.
After deploying pre-hire skills assessments at the top of the funnel, the pipeline looked different. Testlify’s library of 3,500+ role-specific tests narrowed the initial applicant pool by 62% before the first recruiter call. The interview-to-offer ratio improved from 8:1 to 3:1. Time-to-fill for senior engineering roles dropped from 58 days to 31 days. Each hiring decision had a documented score tied to a measurable skills standard, a record that holds up when a rejected candidate asks for feedback or when an audit requires explanation.
The same principle holds across industries and role types: assess at the top of the funnel, not the middle.
How does data reduce bias in hiring?
Data reduces bias by making every candidate clear the same measurable bar. When the team evaluates candidates on standardized assessment scores rather than unstructured impressions, the factors that fuel unconscious bias, including name, university, personal rapport, and communication style, carry less weight in who advances. The scoring creates a trail that an impression never does.
Testlify delivers the same questions in a randomized order to every candidate and grades results against standardized benchmarks. This is a practical way to reduce unconscious bias in hiring at scale without adding process overhead or requiring training to change individual behavior.
The data also helps teams audit their own patterns. If a particular role shows that candidates from a specific source consistently score lower but get advanced more often, that is a signal that the assessment weights or the review process needs examination. Understanding the importance of data-driven hiring starts with recognizing that data does not erase bias; it makes bias visible and therefore addressable.
Bottom line: A scored assessment only reduces bias if the test itself is job-relevant and validated. Measuring a skill the role does not need moves the bias somewhere harder to see. Audit what you assess as carefully as you audit who you hire.
How does Testlify support data-driven hiring?
Testlify turns assessment scores into a structured decision-making workflow. Hiring managers see real-time candidate rankings against global benchmarks, skill gap reports showing exactly where a candidate falls short of role requirements, and customizable reporting that connects assessment data to the metrics a specific team cares about.
The platform’s 3,500+ tests cover 4,500+ job roles across 50+ industries. With integrations to 100+ ATS tools, assessment data flows directly into the hiring workflow rather than sitting in a separate system that requires manual transfer.
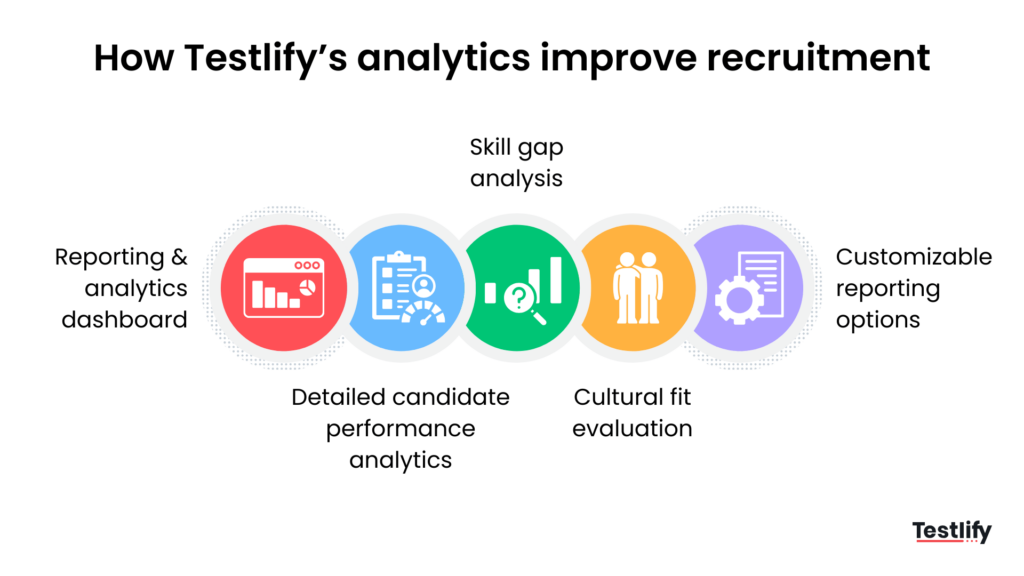
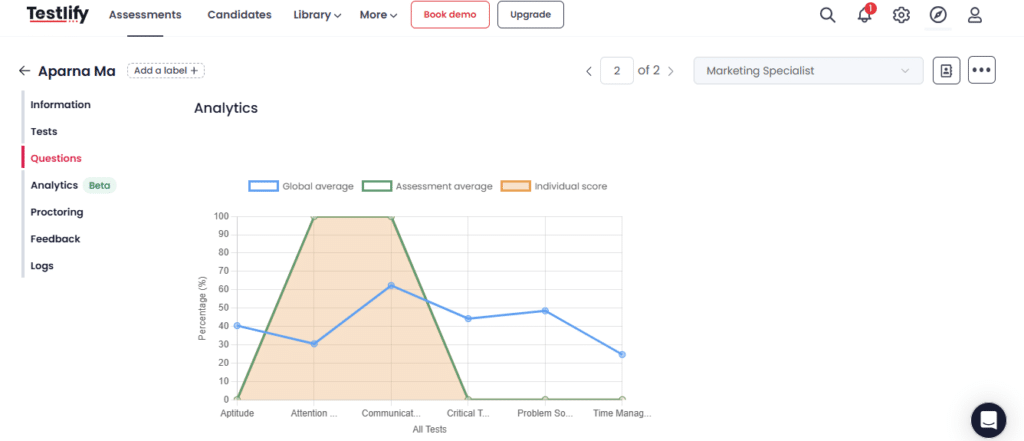
Reporting and analytics dashboard
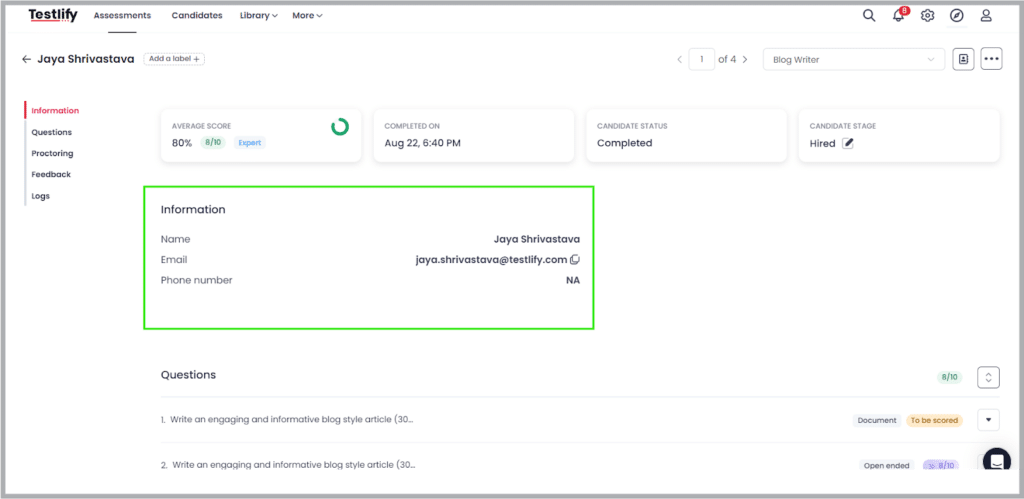
Hiring managers see candidate results in real time. The dashboard shows the global average, the assessment average, and each individual score, so a candidate can be benchmarked against the wider pool rather than the interviewer’s memory of the last person they spoke with. Both recruiters and candidates receive a scorecard PDF by email the moment the assessment is complete. The per-question report can also be downloaded to show exactly how a candidate answered and how long they took.
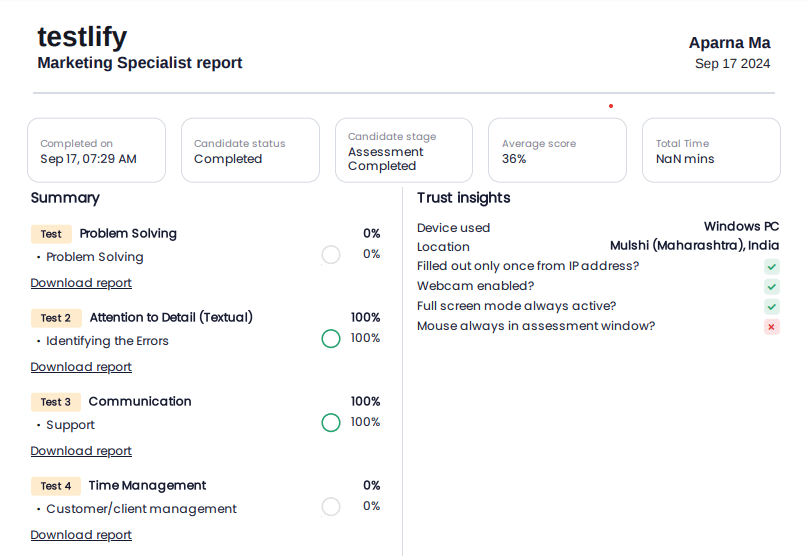
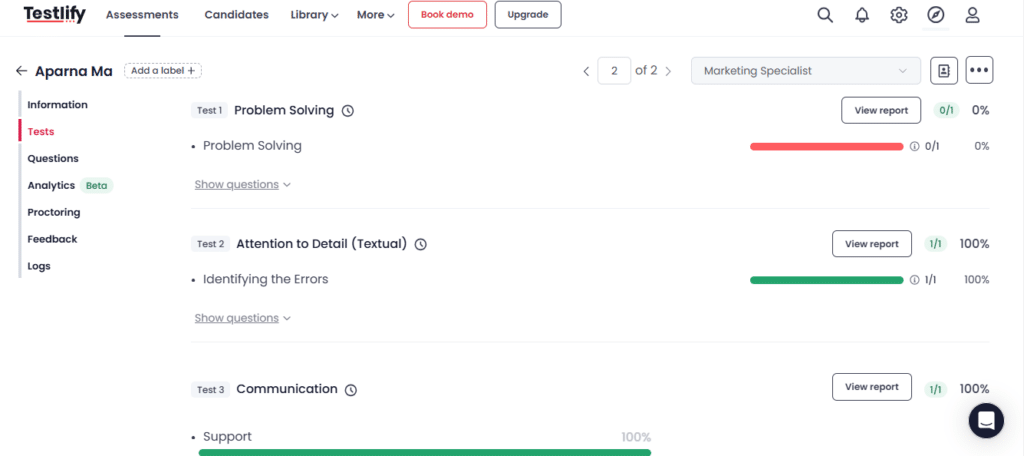
Candidate performance analytics
Testlify breaks down performance across skill proficiency, behavioral traits, and cognitive ability, so the team compares candidates on the same dimensions. This allows:
- Fast identification of the strongest candidates, which shortens the shortlist and cuts time-to-fill.
- Side-by-side comparison against a global benchmark, so the decision rests on data rather than interview performance.
Skill gap analysis
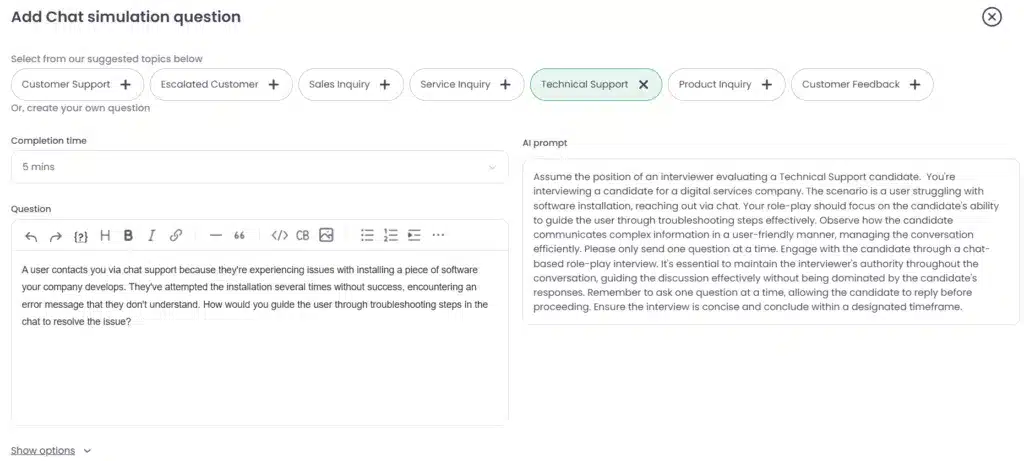
The platform runs skill gap analysis on every candidate, showing exactly where someone falls short of what the role requires. It also tests judgment through interactive scenarios like chat simulations that show how a candidate handles a realistic situation in real time. The gap reports can be used to:
- Identify missing competencies against job requirements and plan targeted onboarding accordingly.
- Tune the job description to attract candidates who already have the skills the current pool keeps missing.
Cultural fit evaluation
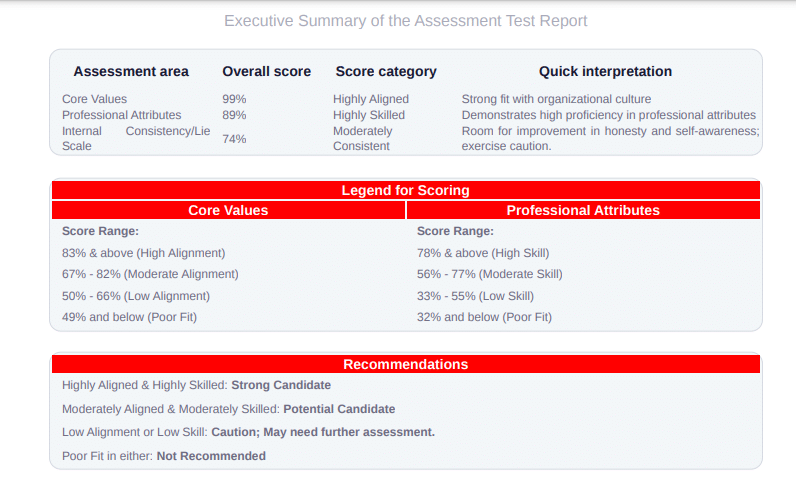
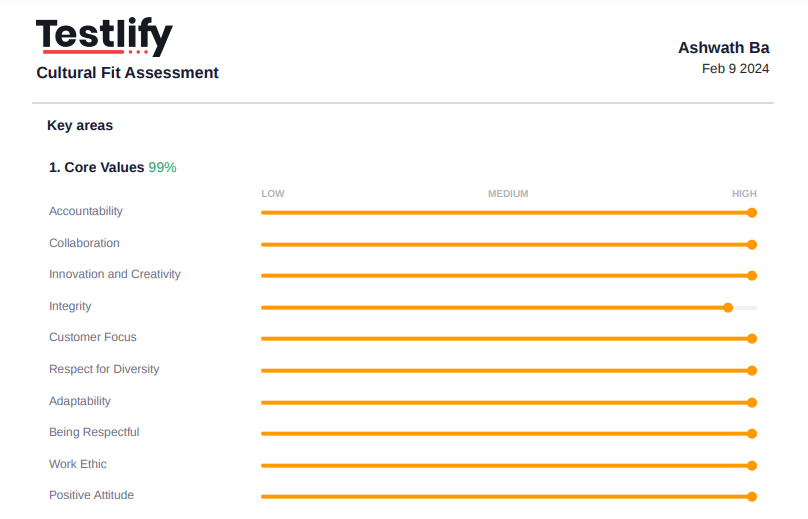
Testlify assesses how a candidate’s working style aligns with the team. Used carefully, this checks for genuine alignment on how work gets done, which supports retention, without turning into a “hire people like us” filter. The assessment measures fit on values and work style the same way for every candidate, not a subjective impression.
Customizable reporting
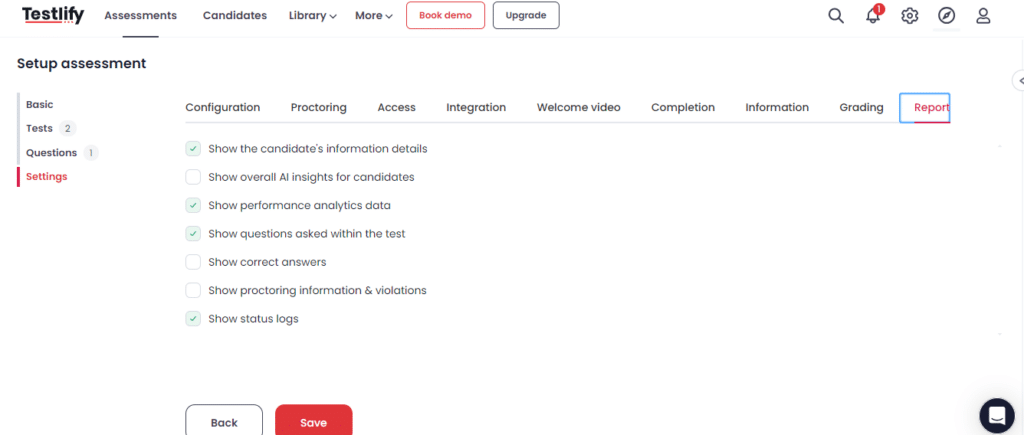
Different teams track different numbers. Testlify builds reports around the metrics that match specific goals: performance analytics, completion status logs, or proctoring flags. The people reviewing candidates see what matters to them and skip what does not.
How do AI and predictive analytics shape hiring in 2026?
AI and predictive analytics extend data-driven recruitment from describing what happened to forecasting what will happen next. Rather than just scoring a candidate’s current skill level, AI-assisted tools can model which assessment patterns correlate with strong performance in specific roles, turning historical hiring data into a forward-looking signal.
The practical application in 2026 is predictive scoring that identifies which candidates are most likely to hit 90-day performance targets, not just which ones passed the test. SHRM’s research on data-driven recruiting shows that organizations using analytics in talent acquisition report measurably stronger ROI on their recruiting investment than those using traditional selection methods alone.
Honest context: AI-assisted scoring is only as reliable as the quality and diversity of the historical data it draws on. Teams using AI prediction tools need to audit their models for the same bias patterns they would review in any other selection tool. Set-and-forget is not a valid operating approach for a predictive hiring model.
The teams seeing the strongest results in 2026 treat assessment design as a living process. They validate tests against post-hire performance data on a regular cycle, recalibrate scoring weights when job requirements shift, and use reporting dashboards to spot patterns before they become systematic problems.
Hire smarter with Testlify
Pick one open role this week. Decide the two skills that matter most, set the bar, and score the whole pool before the first call. That single change is the fastest way to see the difference data makes. Book a demo to see Testlify scorecards and analytics on your own roles, or start free and run your first skills assessment today.
Key Takeaways
- Data narrows the field before the first call. Scoring every applicant on the two or three skills a role actually needs means recruiters spend their time on a ranked shortlist, not a stack of resumes. The result is a shorter screening loop and fewer gut-feel rejections that quietly remove strong candidates.
- Pick a few metrics and act on them. Quality of hire, time to hire, and source effectiveness tell a clearer story than a dashboard of twenty numbers nobody reads. Track the handful that change a decision, and review them on a set cadence so the data drives the next hire.
- Structured scoring is the strongest bias control. When every candidate answers the same questions against the same rubric, the decision rests on demonstrated skill instead of pedigree or rapport. That gives the hiring team a defensible record for every choice and a fairer process for every applicant.
- Assessment data only helps if it reaches the hiring manager. A score buried in a separate tool changes nothing. Pushing results into the same view where shortlisting happens is what turns measurement into a faster, more consistent decision.
- Predictive analytics support judgment, they do not replace it. Models can flag which signals line up with on-the-job success, but a person still owns the hire. Treat the prediction as one input, check it against real outcomes, and drop any signal that stops holding up.
- Start small to prove the value. One open role, two priority skills, and a scored pool before the first interview is enough to show the difference data makes. A contained pilot builds the evidence and the internal buy-in needed to roll the approach out wider.
Frequently asked questions (FAQs)

Content Writer
Yashika Khandelwal is a Content Writer with 3+ years of experience creating research-backed content on hiring, talent assessment, and HR technology. She is a registered Organizational Psychologist and subject matter expert who combines behavioral science with practical recruitment insights to produce accurate, evidence-based content.
LinkedInRelated resources
View all
Hiring Guide
Why are soft skills the new hard skills?

Hiring Guide
How to build a bias-free hiring process in 2026
Hiring Guide
ROI of Smarter Hiring: Cut Cost and Lift Quality of Hire

Hiring Guide
How to future-proof recruitment process with AI in hiring?

Hiring Guide
How does Testlify prevent cheating in AI pre-hire assessments?
Hiring Guide
Why are hiring and training employees essential in 2026?
Get started.
Hire on proof, not resumes.
Run your first skills-based assessment free — no credit card required.