
Top 7 recruitment KPIs and how to effectively track them in 2026
Discover the 7 top recruitment KPIs for 2025 and learn how to track and optimize them to enhance your hiring strategy effectively.

Hiring has never been more expensive, more competitive, or more consequential than it is in 2026. The days of measuring recruitment success by how many roles got filled are long gone.
Today, the organizations winning the talent game are the ones tracking the right recruitment KPIs, asking the right questions, and acting on what the data is actually telling them. The challenge is that most HR teams are drowning in data but starving for insight.
The solution is not more data. It is better data, organized around the metrics that genuinely matter. This guide covers the seven recruitment KPIs that consistently separate high-performing talent acquisition teams from the rest.
 ChatGPT
 Gemini
 Claude
 Grok
Grok Perplexity
The problem with recruitment metrics today
A Deloitte Global Human Capital Trends report found that while 71% of organizations consider people analytics a high priority, fewer than 10% feel they have a strong handle on their talent data. That gap between intention and execution is where most recruitment measurement problems live.
The most common issues are:
- Teams track vanity metrics like application volume and time to post rather than outcome metrics like quality and retention
- KPIs are reviewed monthly or quarterly instead of in real time, making it impossible to course correct mid-search
- Metrics are tracked in silos, with speed data in the ATS, quality data in the HRIS, and cost data in Finance, and nobody is connecting the dots
- Recruiters are measured on fill rates alone, which incentivizes speed over fit

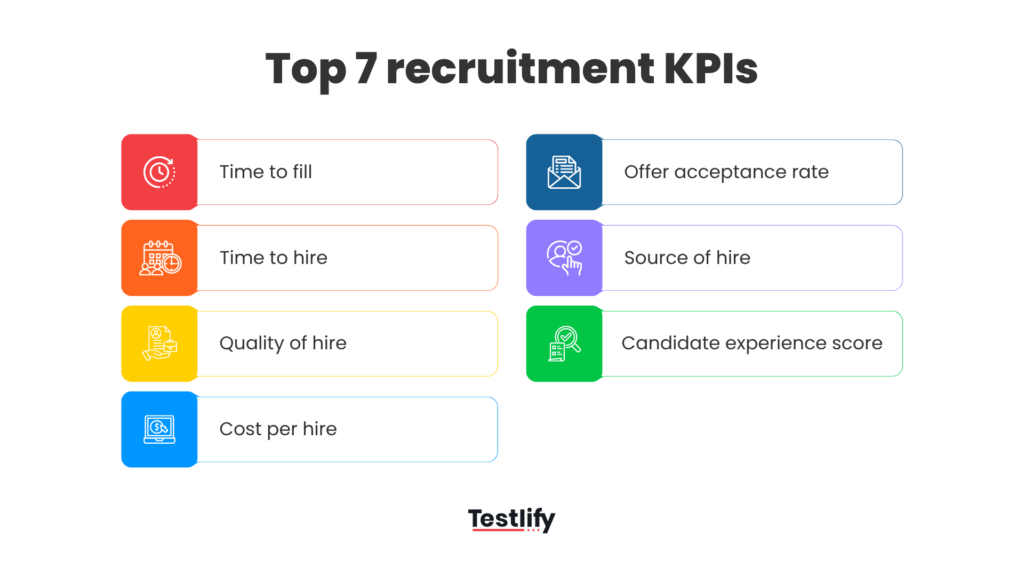
Top 7 recruitment KPIs in 2026
The seven KPIs covered in this guide are specifically chosen because they cut through these problems and improve hiring outcomes. Together they give you a complete and honest picture of your recruitment function, one you can take to your leadership team with confidence.
Time to fill
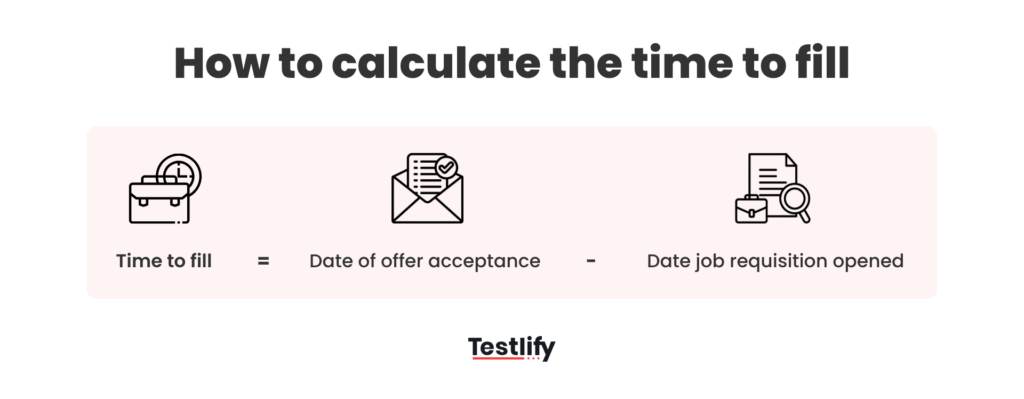
Time to Fill is the number of calendar days between the date a job requisition is officially opened and the date a candidate accepts an offer. It is one of the most widely tracked recruitment metrics and, when used correctly, one of the most powerful early warning signals in your hiring system.
What the data says
According to SHRM’s Talent Acquisition Benchmarking Report, the average Time to Fill across all industries in the United States is approximately 44 days. But breaking that number down by context tells a much more useful story:
- Technology and engineering roles average 60 to 80 days due to talent scarcity and multi-stage interview processes
- Healthcare and clinical roles average 49 days, with specialist positions running significantly longer
- Retail and hospitality roles should ideally close in under 21 days, given high volume and urgency
- Financial services roles average around 40 days, though senior and compliance-heavy roles take longer
Why it matters beyond the numbers
Every open role carries a cost that never shows up in your recruitment budget. Research from the Society for Human Resource Management estimates that a vacant position costs organizations an average of one-third of that role’s annual salary per month in lost productivity, team strain, and missed deliverables.
For a position paying $90,000 per year, that is $30,000 sitting on the table every single month the seat is empty.
What slows time to fill down most often
- Internal approval bottlenecks before the role even goes live, which account for 20 to 30% of total fill time in most organizations
- Poorly written job descriptions that attract the wrong candidates and inflate screening time
- Interview panel scheduling conflicts that add days or weeks to each stage
- Lack of alignment between hiring managers and recruiters on the ideal candidate profile
How to track it effectively
Set job category benchmarks, not a single company-wide target. A 30-day Time to Fill is excellent for a customer service coordinator and concerning for a machine learning engineer.
Your ATS should be calculating this automatically, and alerts should trigger when specific roles breach category thresholds, prompting a proactive sourcing review rather than a reactive scramble.
Time to hire
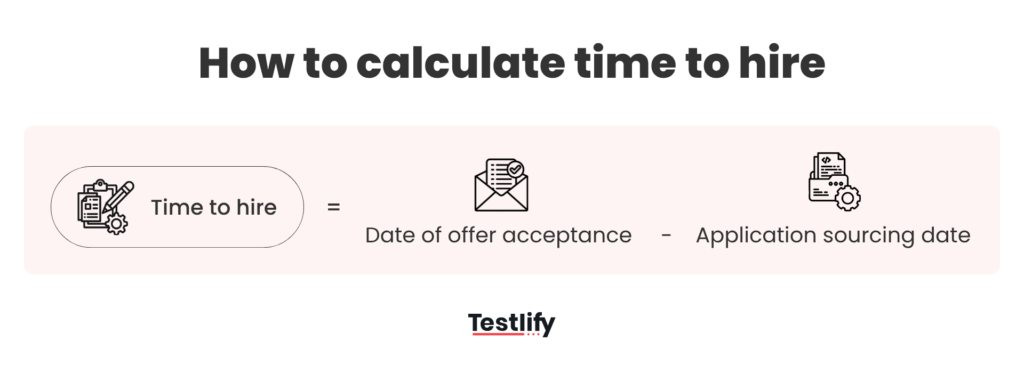
Time to hire measures the number of days from when a candidate first applies to when they accept an offer. Where Time to Fill looks at organizational efficiency, Time to Hire looks at the candidate’s experience of your process speed and reflects how competitive you are in real time.
The competitive reality in 2026
The talent market has fundamentally shifted the power dynamic in hiring. LinkedIn’s Global Talent Trends research consistently shows that top candidates are off the market within 10 days of beginning their job search.
Separately, a survey by the candidate experience platform Talent Board found that 60% of candidates have abandoned a job application midway through because the process was too long or too complex.
For employers, the implication is stark. A slow process is not just an inconvenience but a direct competitive disadvantage.
Key time to hire benchmarks by stage
- Application to first contact: Ideally, within 48 hours, with a hard ceiling of 5 business days
- First contact to interview: No more than 7 days, candidates interpret long gaps as disorganization
- Interview to offer: 3 to 5 business days for most roles, though technical assessments may extend this slightly
- Offer to acceptance: 48 to 72 hours in most cases, with senior roles allowing up to a week
What is actually slowing your time to hire
Most hiring leaders assume candidate availability is the primary driver of delays. Research suggests otherwise. The biggest contributors to the slow time to hire are:
- Interviewer feedback latency, with panels often taking 3 to 5 days to submit structured feedback after interviews
- Unclear decision-making authority, where multiple stakeholders need to approve each stage without a defined process
- Poorly calibrated technical assessments that are too long or too complex, causing candidate dropout
- Scheduling friction, particularly across time zones or with senior panel members whose calendars are heavily restricted
How to track time to hire effectively
Break Time to Hire down by stage rather than tracking only the total. A stage-level view tells you exactly where candidates are waiting and gives you specific, actionable targets for improvement. Implement 24-hour feedback submission requirements for all interviewers and track compliance as a separate metric within your TA operations dashboard.
Related resources: Gain insights into your hiring efficiency with Testlify’s average time-to-hire calculator
Quality of hire
If there is one KPI that separates mature talent acquisition functions from reactive ones, it is Quality of Hire. It is the most strategically significant metric in recruitment and, by a wide margin, the hardest one to measure well.
Quality of Hire is a composite measure that evaluates how much real value a new hire delivers to the organization relative to expectations at the time of hire. It is not a single data point. It is a story told across multiple signals over time.
Why it matters more than any other metric
A LinkedIn survey of talent acquisition professionals found that Quality of Hire is considered the single most valuable KPI by 40% of respondents, outranking Time to Fill, Cost Per Hire, and every other metric. And yet fewer than a third of organizations have a consistent, documented method for measuring it.
The cost of ignoring it is high. Research from the U.S. Department of Labor estimates that a bad hire can cost up to 30% of the employee’s first year’s earnings.
SHRM puts that figure higher, suggesting the total cost, including lost productivity, management time, and recruitment can reach 50 to 60% of annual salary for mid-level roles and 200% or more for senior leadership positions.
How to build your Quality of Hire composite score
There is no universal formula, but the most effective models combine the following signals with weighted importance:
- Performance rating at 90 days and 6 months (suggested weight: 35 to 40%)
- 12-month retention, whether the employee is still with the organization at the one-year mark (suggested weight: 25 to 30%)
- Hiring manager satisfaction score collected via structured post-hire surveys at 30, 60, and 90 days (suggested weight: 15 to 20%)
- Speed to full productivity or ramp time compared to the role average (suggested weight: 10 to 15%)
- Peer and team lead cultural fit rating from a brief structured assessment (suggested weight: 5 to 10%)
How to track it effectively
The infrastructure for tracking Quality of Hire lives across your ATS, your HRIS, and your performance management system. That means tracking it well requires genuine cross-functional collaboration between Talent Acquisition, People Analytics, and line managers.
Automate post-hire survey triggers in your HRIS at 30, 60, and 90 days post start date. Make hiring manager participation non-negotiable by tying it to recruiter close-out processes. And most importantly, aggregate your Quality of Hire scores by source channel so you understand not just how well you are hiring overall, but which parts of your sourcing strategy are generating the most valuable hires.
Related resources: Measure the real impact of your hires in seconds using Testlify’s free quality of hire calculator
Source of hire
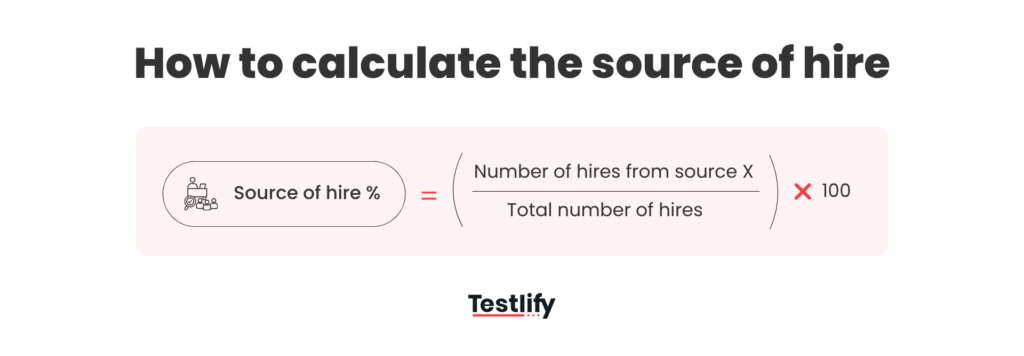
Source of Hire tracks which channel or touchpoint brought each successfully hired candidate into your pipeline. On the surface, it sounds straightforward. In practice, it is one of the most misunderstood and underutilized KPIs in recruitment analytics.
Why most source attribution data is broken
A 2024 survey by recruiting software company Jobvite found that nearly half of talent acquisition teams describe their source of hire data as “somewhat unreliable” or “unreliable.” The reasons are predictable:
- Recruiters use inconsistent source labels in their ATS, creating data that cannot be meaningfully aggregated
- Single-touch attribution models credit only the last channel a candidate interacted with before applying, ignoring the full journey
- Candidates themselves often cannot accurately recall where they first heard about a role, particularly if they were passively sourced
- Dark social channels, including direct referrals via text or private messaging, go entirely untracked
What clean source attribution actually reveals
When organizations do track Source of Hire accurately, the findings consistently challenge conventional wisdom about where recruiting budgets should go. Research from iCIMS and LinkedIn’s combined talent data suggests the following patterns hold true across most industries:
- Employee referrals produce 30 to 50% of all hires while consuming roughly 5 to 10% of total sourcing spend
- Referral hires have a first-year retention rate 45% higher than hires from job boards
- Direct sourcing through LinkedIn and professional outreach produces higher Quality of Hire scores than most inbound channels
- Job board spend, which consumes 30 to 40% of most external recruiting budgets, produces a disproportionately low share of high-quality, long-tenure hires
The multi-touch attribution advantage
The emerging standard in 2026 is multi-touch attribution, which credits all channels a candidate engaged with before applying, rather than just the last one. Practically, this means using UTM parameters on all digital sourcing links, integrating your careers site analytics with your ATS, and building a consistent tagging taxonomy that all recruiters follow without exception.
How to track the source of hire effectively
Run a quarterly source performance review that looks at three dimensions for each channel: volume of hires, average Quality of Hire score, and cost per hire from that channel. A channel that generates volume but scores low on quality and high on cost is actively costing you more than it appears to be delivering. That analysis alone will reshape most recruiting budgets.
Related resources: Identify the most cost-effective hiring channels using our free sourcing channel efficiency calculator
Cost per hire
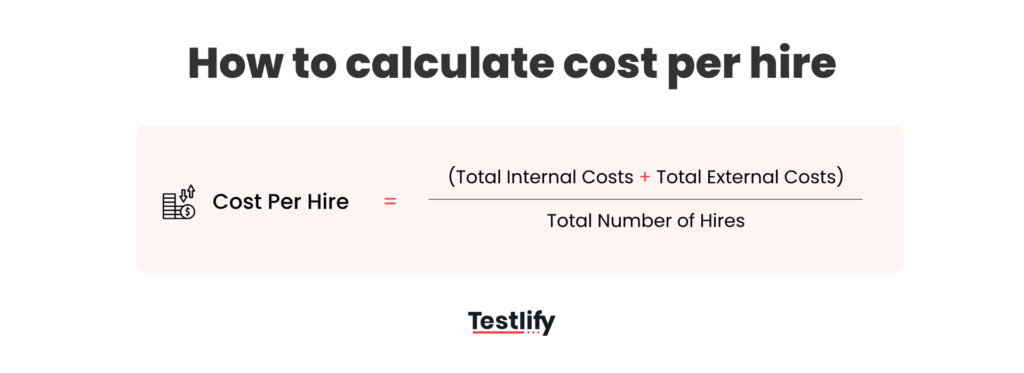
Cost Per Hire is the total investment required to successfully fill one open position. It is a KPI that most organizations track in some form, but very few track honestly. The gap between what teams think they spend on hiring and what they actually spend is almost always significant.
Breaking down the true cost of hire
Internal costs include:
- Hiring manager and interview panel time (often overlooked but frequently the largest single cost component)
- HR technology and ATS licensing fees
- Employee referral bonuses
- Internal onboarding and training overhead
External costs include:
- Job board advertising fees (LinkedIn, Indeed, niche boards)
- Recruitment agency or executive search fees, which typically range from 15 to 25% of the first year’s salary
- Background screening and pre-employment assessment tools
- Employer branding and careers site investment
- Relocation packages and signing bonuses were applicable
What the benchmarks say
SHRM’s most recent data puts the average Cost Per Hire in the United States at approximately $4,700, but this figure masks enormous variation by role level and function. More realistic breakdowns look like this:
- Entry-level and high-volume roles: $1,500 to $3,000 per hire
- Mid-level professional roles: $5,000 to $10,000 per hire
- Senior individual contributors and managers: $15,000 to $30,000 per hire
- Director level and above with executive search involvement: $30,000 to $100,000 or more
The most important cost per hire insight
Cost per hire only becomes a genuinely useful metric when it is read alongside Quality of Hire. A $2,000 hire who exits in six months or underperforms for two years is dramatically more expensive than a $15,000 hire who stays for five years and exceeds expectations.
Teams that optimize cost per hire in isolation consistently make this mistake, cutting corners on sourcing, assessment, and candidate experience to reduce spend, and then wondering why retention and performance outcomes suffer.
The right question to ask is not “how do we lower cost per hire?” It is “how do we optimize cost per hire relative to the quality and longevity of the hires we make?”
Offer acceptance rate
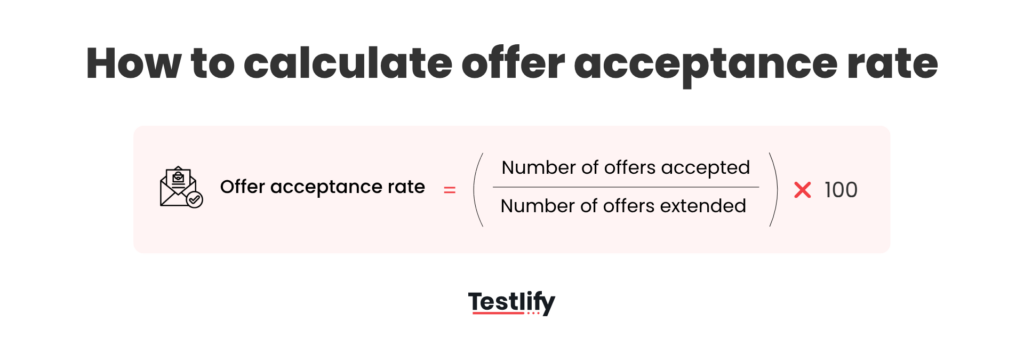
Offer Acceptance Rate is the percentage of formal job offers that candidates accept. It is the final checkpoint in your hiring funnel, and its performance is a direct report card on how well you understand your candidates, your market, and your own employer brand.
How to calculate the offer acceptance rate
What the benchmarks tell you
- 90% or above: Healthy and competitive. Your compensation, EVP, and candidate experience are aligned with market expectations.
- 80 to 89%: Acceptable but worth investigating by role type and source. There may be pockets of misalignment that aggregated data is masking.
- 70 to 79%: A meaningful problem. One in four candidates you invest in reaching the offer stage is choosing someone else. Immediate diagnosis is warranted.
- Below 70%: A crisis state. This level indicates systemic misalignment between what you are offering and what the market expects, and it is costing you enormous amounts of wasted hiring investment.
The three root causes of low offer acceptance rates
Nearly every decline in the Offer Acceptance Rate traces back to one of three sources:
Compensation misalignment
Compensation misalignment is the most common and most preventable cause. A survey by Mercer found that 68% of candidates who declined job offers cited total compensation as the primary reason.
The fix is simple: conduct formal salary benchmarking at the job description stage, not at the offer stage.
Candidate experience breakdown
Candidate experience breakdown occurs when the interview process itself erodes a candidate’s enthusiasm for the role. Slow feedback, disorganized logistics, inconsistent messaging from interviewers, and a lack of genuine engagement all signal to a candidate that the organization’s culture may not match its pitch.
A weak Employee Value Proposition (EVP)
A weak Employee Value Proposition (EVP) is the hardest to fix but the most important to address. In 2026, candidates research employers the way consumers research products. Glassdoor data shows that 86% of job seekers read company reviews before deciding whether to apply, and that number only rises as candidates progress through an interview process.
If your EVP is unclear, inconsistent, or not reflected in how your interviewers present the role, candidates will notice.
How to track offer acceptance rates effectively
Beyond the rate itself, build a structured decline tracking process. Every declined offer should be followed by a brief exit survey or recruiter conversation that captures the primary reason for declining.
Categorize decline reasons consistently across: compensation, competing offer, role fit concerns, process experience, location or flexibility, and EVP or culture. Track the distribution of those categories quarterly and look for trends. This data is arguably the most direct competitive intelligence a talent acquisition team can collect.
Related resources: Track how many interviews turn into real offers using Testlify’s free job offer acceptance rate calculator
Candidate experience score
Candidate Experience Score quantifies how candidates perceive and feel about your recruitment process from the first touchpoint to final outcome. It is, without question, the most underinvested KPI in most organizations’ talent acquisition dashboards, and in 2026, it carries consequences that extend well beyond the HR function.
How to measure it
The most widely adopted and reliable approach is a candidate Net Promoter Score, adapted from the customer experience methodology. Ask every candidate who moves through your process, regardless of outcome, the following question:
“On a scale of 0 to 10, how likely are you to recommend applying to this company to a friend or colleague?”
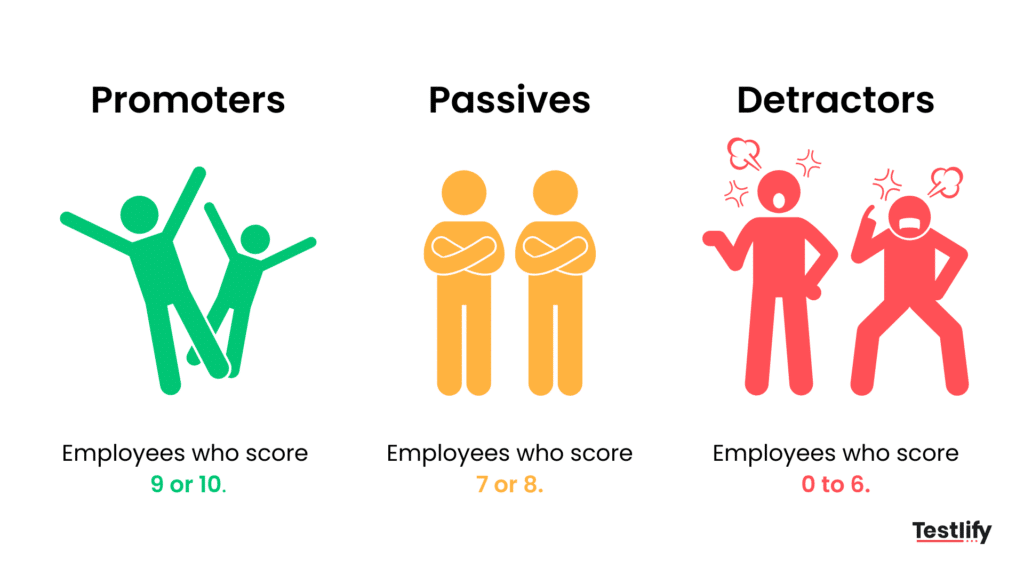
Responses are segmented as follows:
- 9 to 10: Promoters, candidates who had a positive experience and are likely to recommend your company to others
- 7 to 8: Passives, candidates who had a neutral experience and are unlikely to either advocate or discourage others
- 0 to 6: Detractors, candidates who had a negative experience and may actively warn others against applying
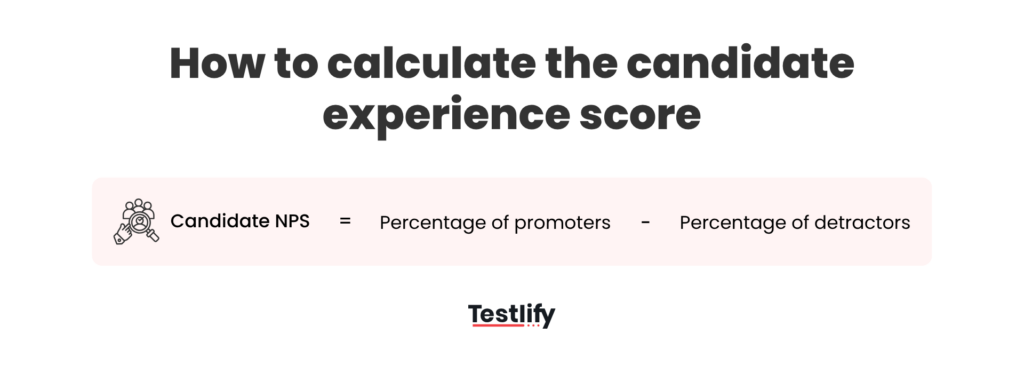
Supplement the overall score with stage-specific pulse surveys after key milestones: application acknowledgment, post-interview, and post-offer. Stage-level data tells you exactly which parts of your process are creating friction.
Why this is a business metric, not just an HR metric
The business case for Candidate Experience is compelling and frequently underestimated:
- According to IBM’s Smarter Workforce Institute, candidates who have a positive experience are 38% more likely to accept a job offer
- The Talent Board’s annual Candidate Experience Research Report found that candidates who have a negative experience are twice as likely to sever their relationship with that company as a consumer
- Glassdoor research shows that organizations with strong candidate experience scores receive 50% more qualified applicants, reducing sourcing costs and improving the overall talent pool quality
- In industries where the candidate pool and customer base overlap, such as retail, hospitality, financial services, and healthcare, a poor hiring experience can directly impact revenue
Common candidate experience failures and their fixes
Silence after application submission: This is the number one driver of negative candidate sentiment. Implement automated acknowledgment messages within 24 hours of every application received, regardless of whether the candidate progresses.
Long gaps between interview stages: Long gaps between interview stages without proactive communication create anxiety and signal disorganization. Assign a dedicated point of contact for every candidate in process and set a standard that no candidate should go more than 5 business days without hearing from your team.
Poor rejection communication: Research has found that 70% of candidates who had a negative experience cited poor or nonexistent rejection communication as a primary reason. A thoughtful, timely rejection message costs nothing and preserves both the candidate’s goodwill and your employer brand.
Inconsistent interviewer behavior: When you have some interviewers who are prepared and communicative, while others are distracted, late, or dismissive, it creates unpredictable experiences that are difficult to manage at scale.
Interviewer training and structured interview scorecards are the standard fix, and they improve both candidate experience and Quality of Hire simultaneously.
How to track candidate experience score
Automate survey delivery through your ATS or CRM at each stage of the candidate journey. Review Candidate NPS monthly, segment by role type, hiring manager, and interview stage. Most importantly, act on the feedback visibly and communicate what has changed. Candidates and employees both notice when their input leads to tangible improvement, and that response in itself becomes a positive signal about your organizational culture.
Which recruitment KPI should hiring managers focus on?
The main objective of recruitment KPIs is for recruiters to know how well or poorly their strategy is performing. This enables recruiters to make changes to align their strategy with organizational needs.
The first step is to have a clear understanding of the hiring objective. Based on that, the basic indicators you need to track should give you an idea about:
- Lower employee turnover
- Source from a broader and more diverse candidate pool
- Attract top-quality candidates
- Reduce recruitment expenses
- Simplify and streamline the hiring process
- Accelerate the time to fill open positions
When determining the best recruitment KPIs, there isn’t a one-size-fits-all answer. The most valuable KPIs are those that align with your current hiring objectives and track progress toward specific goals.
Recommended reading: The ultimate list of HR KPIs for success
How to build a recruitment KPI system that actually works
Knowing which seven metrics to track is the starting point. Making them work together as a coherent measurement system is where the real operational work begins.
Start with a simple audit
Before setting any targets, assess what your current ATS, HRIS, and analytics tools are already calculating. Most modern platforms, including Greenhouse, Lever, iCIMS, Workday, and SmartRecruiters, automatically calculate speed metrics. Quality, experience, and source metrics typically require intentional configuration and cross-functional data sharing to be meaningful.
Establish baselines before setting targets
A minimum of two to three months of clean, consistently collected data is needed before benchmarks are meaningful. Setting aggressive targets against unreliable baselines creates pressure to manage numbers rather than improve processes.
Make the data visible across the organization
Recruitment KPIs have the most impact when hiring managers, HR business partners, finance partners, and senior leaders are all working from the same dashboard. Decisions about headcount planning, sourcing investment, and interview process design all improve when they are informed by accurate talent acquisition data.
Review and iterate quarterly
The relative importance of these seven metrics will shift as your organization grows, the talent market evolves, and hiring priorities change. Build a quarterly review cadence that includes representatives from TA, People Analytics, Finance, and at least one senior business leader. That review is where recruitment KPI data becomes a genuine talent strategy.
See how Testlify can strengthen your recruitment KPIs
Tracking the right metrics is only half the equation. The other half is having the right tools in place to actually improve them.
Testlify is a leading talent assessment platform that helps hiring teams make faster, higher-quality, and more objective hiring decisions at every stage of the recruitment process. Here is how Testlify directly impacts the KPIs covered in this guide:
- Time to hire: Testlify’s automated assessments replace time-consuming manual screening rounds, reducing early-stage evaluation time by up to 80% and accelerating your pipeline without sacrificing rigor.
- Quality of hire: Role-specific, scientifically validated assessments give you a reliable signal of candidate capability before the interview stage, significantly increasing the likelihood that the hire you make is the right one.
- Candidate experience score: Testlify’s assessment experience is designed with the candidate in mind. Clean, mobile-friendly, and transparent, it consistently earns positive feedback even from candidates who do not progress further in the process.
- Cost per hire: By reducing dependency on lengthy multi-round interview processes and third-party screening vendors, Testlify helps organizations lower the cost of identifying qualified candidates without compromising on quality.
- Offer acceptance rate: When candidates move through a well-structured, assessment-backed process, they arrive at the offer stage with stronger conviction about the role and the organization. That confidence shows up directly in your acceptance rate.
Whether you are looking to tighten your screening process, reduce interviewer bias, or simply make better use of the hiring data you already have, Testlify gives your talent acquisition team the infrastructure to perform at a higher level across every metric that matters.
Ready to see the difference Testlify makes to your recruitment KPIs?
Book a demo with Testlify today and discover how leading hiring teams are using data-driven assessments to hire smarter, faster, and with greater confidence in 2026.
Frequently asked questions (FAQs)

Related resources
View all
HR & recruitment
9/80 work schedule: A definitive guide for 2026

HR & recruitment
What is job enlargement and how to implement it? Pros & Cons

HR & recruitment
Corporate Recruiting: Definition, Process, and Best Practices

HR & recruitment
Skills vs competencies: What’s the difference?

HR & recruitment
How to create talent sourcing strategies in 6 easy steps?

HR & recruitment
Are boomerang employees the next big hiring trend?
Get started.
Hire on proof, not resumes.
Run your first skills-based assessment free — no credit card required.