
The ultimate guide to recruitment KPIs
Most recruiters are drowning in data but starving for insight. They track dozens of recruitment KPIs, build elaborate spreadsheets, and sit through quarterly reviews armed with charts, yet still can’t confidently answer the question their CEO is really asking: “Is our hiring process bringing in top talent?” This isn’t a technology problem. It’s a strategy…Most recruiters are drowning in data but starving for insight. They track dozens of recruitment KPIs, build elaborate spreadsheets, and sit through quarterly reviews armed with charts, yet still can’t confidently answer the question their CEO is really asking: “Is our hiring process bringing in top talent?”
This isn’t a technology problem. It’s a strategy problem, and we’ve seen the same issue repeat itself: organizations confuse activity with impact. Recruiters measure what’s easy to count, not what actually moves the needle.
That changes today. This guide is meant to serve as a blueprint for building a recruitment measurement system that ties directly to business outcomes.
Summarise this post with:
 Chatgpt
 Gemini
 Claude
 Grok
Grok Perplexity
What are recruitment KPIs, and why do most teams get them wrong?
A recruitment KPI (Key Performance Indicator) is a quantifiable measure that evaluates how effectively your hiring process is in achieving its key objectives. The keyword there is key. Not every metric is a KPI. Not everything worth measuring deserves a dashboard tile.
Here’s the distinction we make:
Metrics tell you what happened: applications received, interviews conducted, offers extended. KPIs tell you whether it mattered: did you hire the right people, fast enough, at the right cost, through the right channels?
The gap between those two things is enormous. And it’s exactly where most talent acquisition teams lose the plot.
A recruiter tracking “number of LinkedIn messages sent” is measuring activity. A recruiter tracking “sourced-to-hired conversion rate by channel” is measuring impact. One tells you how busy your team was. The other tells you if the work is actually producing results.
In 2026, with AI-assisted hiring tools, talent market volatility, and intense scrutiny on HR ROI, the cost of measuring the wrong things has never been higher.
The three tiers of recruitment KPIs
Before we dive into specific metrics, it helps to understand that not all recruitment KPIs serve the same master. I organize them into three tiers.
Tier 1: Operational KPIs
Operational KPIs measure the efficiency of your hiring process. How fast are candidates moving through your hiring pipeline? How much does it cost to hire the best candidates? These essentially are the plumbing metrics, essential infrastructure, but not the full story.
Tier 2: Strategic KPIs
Strategic KPIs measure the quality and business impact of your hiring. Are the people you’re bringing in actually performing? Are they staying? These are the metrics your C-suite should care most about.
Tier 3: Experience KPIs
Experience KPIs measure how candidates feel about your process. In an era where a single Glassdoor review can deter hundreds of qualified applicants, this tier is more commercially critical than most leaders realize.
The goal is balance across all three. Teams that optimize only for Tier 1 metrics tend to hire fast and cheap, but sacrifice quality. Teams that focus exclusively on Tier 2 without watching Tier 1 often move too slowly and lose candidates to faster-moving competitors. And teams that ignore Tier 3 quietly erode their employer brand, one poor candidate experience at a time.
How to determine your recruitment KPIs in 2026
This is where most guides skip straight to the metrics list. I’m going to do the opposite, because the how of setting KPIs is more important than which KPIs you pick.
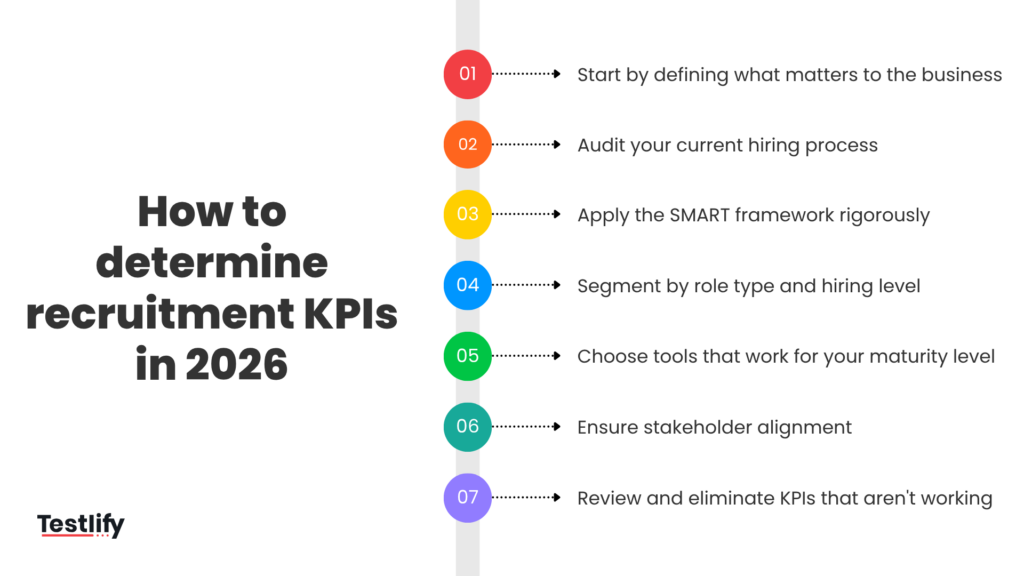
Step 1: Start by defining what matters to the business
Every recruitment KPI should trace a direct line back to a business objective. Before you define a single metric, sit down with your leadership team and ask:
- What are our growth targets for the next 12 months, and what headcount does that require?
- Which roles, if left unfilled, would meaningfully slow the business down?
- Are we in acquisition mode, stabilization mode, or transformation mode?
The answers to these questions should dictate your KPI priorities. A startup scaling aggressively needs to obsess over Time to Fill and Source of Hire, whereas an established enterprise managing high attrition needs to double down on Quality of Hire and Retention Rate.
Step 2: Audit your current hiring process
You cannot improve what you haven’t measured, and you also cannot measure what you haven’t mapped. Before setting new KPIs, walk through your entire hiring process from requisition to first-day onboarding and ask
- Where do candidates drop off most?
- Which stages take the longest, and why? Where do hiring managers express the most frustration?
- Which roles consistently take longer to fill, and what do they have in common?
This audit will reveal your actual bottlenecks, which are almost always different from what leadership assumes they are.
Step 3: Apply the SMART framework rigorously
Every KPI you set should meet all five SMART criteria.
- Specific: Define exactly what you’re measuring. “Improve hiring” is not a KPI. “Reduce average Time to Fill for engineering roles from 62 days to 45 days by Q3.”
- Measurable: Can you consistently capture this data? A KPI you can’t reliably measure is just a wish.
- Achievable: Set targets that stretch your team without breaking them. Base your benchmarks on your own historical data first, then industry data second.
- Relevant: Does this KPI actually connect to a real business outcome? If you can’t explain why it matters to someone outside HR, rethink it.
- Time-bound: Every KPI needs a deadline. Quarterly reviews are the minimum cadence; monthly check-ins on key operational metrics are better.
Step 4: Segment by role type and hiring level
A single company-wide KPI dashboard is almost always misleading. Time to Fill for a senior software engineer looks nothing like Time to Fill for a customer support representative. Offer Acceptance Rate for a C-suite hire is influenced by entirely different factors than for a graduate-level role.
Segment your KPIs by job family (engineering, sales, operations), seniority level (entry, mid, senior, executive), hiring type (permanent vs. contract), and business unit or geography. This segmentation is what separates teams that genuinely understand their data from teams that just report it.
Step 5: Choose tools that work for your maturity level
In 2026, there’s no shortage of recruitment analytics platforms. But more technology doesn’t automatically mean better insight. Choose tools that match where your team actually is.
Early-stage teams will find that a well-structured ATS like Greenhouse, Lever, or Workday Recruiting with built-in reporting is often enough. Mid-market teams should look for HRIS integrations and BI dashboards (Tableau, Looker, Power BI) that pull data across systems.
Enterprise teams should consider AI-native talent intelligence platforms that surface predictive insights, not just historical reports. The best tool is the one your team will actually use consistently.
Step 6: Ensure stakeholder alignment
KPIs that live only in HR are KPIs that get ignored. The most effective recruitment metrics programs I’ve seen share data transparently with hiring managers, business unit leads, and the C-suite, with each audience receiving the level of detail appropriate to their role.
A Head of Talent needs the full funnel. A VP of Engineering filling five roles needs Time to Fill and pipeline health for tech roles only. A CFO reviewing headcount costs needs Cost Per Hire and sourcing ROI. Match the data to the decision-maker.
Step 7: Review, revise, and eliminate KPIs that aren’t working
A KPI that isn’t driving behavior change is a KPI that’s wasting everyone’s time. Build a formal cadence for reviewing your KPI set, not just the numbers, but the metrics themselves. Every quarter, ask: Is this KPI still relevant? Is our team capable of influencing this number? Has the business context changed?
The best talent acquisition leaders we know treat their KPI framework as a living document, not a fixed policy.
7 top recruitment KPIs and how to effectively track them
Now let’s get into the metrics themselves. These seven recruitment KPIs consistently deliver the most strategic value across organizations of all sizes. Master these, and you’ll have a measurement system that genuinely drives hiring performance.
KPI #1: Time to fill
Definition: The number of calendar days between when a job requisition is opened and when an offer is accepted.
Why it matters: Time to Fill is your operational heartbeat. Extended vacancy periods aren’t just an HR inconvenience; they carry real business costs. An open sales role means lost revenue. An unfilled engineering seat means delayed product launches. An unoccupied operations position means work redistribution and eventual team burnout.
In an SHRM benchmark study, the average Time to Fill across industries was approximately 44 days. But averages are deceiving. For specialized technical roles, 60 to 90 days is not unusual. For high-volume entry-level roles, anything above 21 days signals a process problem.
How to calculate time to fill:
Time to Fill = Date of Offer Acceptance – Date Job Requisition Opened
How to track it effectively in 2026: The discipline is in reviewing it by job category, not just as a blended company average. Set alerts for roles that breach defined thresholds. If a senior engineer role hits day 50 without an accepted offer, that should trigger a sourcing strategy review automatically.
Common pitfall: Confusing Time to Fill with Time to Hire. Time to Fill measures from the organization’s clock, meaning when the need was identified. Time to Hire measures from the candidate’s clock, meaning when they applied. Both matter, but for different reasons.
Quick win: Audit your internal approval workflows. In most organizations, 20 to 30% of Time to Fill is consumed by internal bottlenecks before a candidate ever applies, including slow requisition approvals, delayed JD sign-offs, and misaligned interview panel scheduling.
KPI #2: Time to hire
Definition: The number of days from when a candidate submits their application to when they accept an offer.
Why it matters: While Time to Fill measures organizational efficiency, Time to Hire measures your process efficiency from the candidate’s perspective. In 2026’s talent market, this is a competitive weapon.
Top candidates, especially in tech, finance, and healthcare, are fielding multiple offers simultaneously. A slow hiring process doesn’t just cost you time; it costs you specific people to faster-moving competitors.
According to LinkedIn’s Talent Trends data, candidates expect to hear back within a week of applying. Interview-to-offer cycles exceeding 14 days see a measurable drop in candidate engagement and acceptance rates.
How to calculate it:
Time to Hire = Date of Offer Acceptance – Application Sourcing Date
How to track it effectively in 2026: Break this KPI down by hiring stage to pinpoint where candidates are waiting. Is it the screening call? The technical assessment? The final panel interview? A stage-by-stage breakdown will show you exactly where your pipeline is bleeding velocity.
Most modern ATS platforms, including Greenhouse, Lever, and iCIMS, include funnel stage timing as a standard report. If yours doesn’t, you need a better ATS.
Quick win: Implement structured interview scorecards with 24-hour submission requirements for interviewers. The biggest driver of slow Time to Hire in most organizations isn’t candidate availability; it’s internal feedback latency.
Related resources: Gain insights into your hiring efficiency with Testlify’s average time-to-hire calculator
KPI #3: Quality of hire
Definition: A composite measure of the performance, cultural contribution, and long-term value a new hire delivers relative to expectations at the time of hire.
Why it matters: I’ll say it plainly. Quality of Hire is the most important KPI in this entire guide, and it’s also the one most organizations track the worst.
Everything else, including time, cost, and sourcing, is in service of this metric. You can hire someone in 7 days for $500 who quits in 90 days or underperforms for years. Conversely, you can spend 90 days and significant resources finding someone who becomes a 10-year top performer.
Quality of Hire is what anchors your talent strategy to real business value.
How to calculate it: There’s no single universal formula, but the best models combine multiple signals, such as:
- Performance rating at 90 days and 6 months, retention (whether the employee is still with the company at 12 months)
- Hiring manager satisfaction score from post-hire surveys at 30, 60, and 90 days, ramp time (how quickly they reached full productivity)
- Cultural fit assessment from team leads and successful long-term retention efforts.
A weighted composite score, for example, 40% performance, 30% retention, 20% manager satisfaction, and 10% ramp time, gives you a single Quality of Hire score per hire. You can then aggregate this by source channel, recruiter, role type, or time period.
How to track it effectively in 2026: The tracking discipline here lives in the partnership between Talent Acquisition and People Analytics. TA needs to close the loop on every hire, not just fill the role and move on.
Build automated post-hire survey triggers into your HRIS at 30, 60, and 90 days. Track performance ratings consistently. And critically, tie this data back to the sourcing channel so you understand which channels produce not just the most hires, but the best hires.
Quick win: If you do nothing else after reading this guide, start measuring Quality of Hire by source. The difference in performance and retention between hires from employee referrals, direct sourcing, and external agencies is almost always dramatic and almost always surprising.
Related resources: Measure the real impact of your hires in seconds using Testlify’s free quality of hire calculator
KPI #4: Cost per hire
Definition: The total investment required to successfully fill one open position, divided by the total number of hires in a given period.
Why it matters: Recruitment is a significant organizational investment, and most leaders dramatically underestimate its true cost. Beyond job board fees and agency commissions, the full cost of hiring includes internal recruiter time, hiring manager time, interview panel time, background checks, assessment tools, relocation costs, and onboarding overhead.
SHRM’s research estimates the average cost per hire in the U.S. at approximately $4,700, but for specialized or senior roles, that figure can easily exceed $20,000 to $50,000 when all costs are properly accounted for.
How to calculate it:
Cost per hire = (Total Internal Costs + Total External Costs) divided by Total Number of Hires
Internal costs include recruiter salaries (prorated), HR technology, referral bonuses, and onboarding costs. External costs include job board fees, agency fees, background screening, assessment tools, and advertising.
How to track it effectively in 2026: Cost Per Hire requires genuine collaboration between HR and Finance. Build a shared cost tracking model that captures both hard and soft costs consistently. The goal isn’t the lowest possible Cost Per Hire; it’s the optimal Cost Per Hire relative to Quality of Hire. A cheap hire who fails is always more expensive than a well-resourced hire who thrives.
Quick win: Audit your sourcing channel mix. In most organizations, 60 to 70% of external cost is concentrated in channels such as agencies and job boards that don’t necessarily produce the highest Quality of Hire. Shifting even 20% of the budget toward direct sourcing and employee referrals can materially reduce Cost Per Hire without sacrificing quality.
Related resources: Discover the true cost of recruitment with our cost-per-hire (CPH) calculator
KPI #5: Offer acceptance rate
Definition: The percentage of formal job offers extended to candidates that result in an accepted offer.
Why it matters: A low offer acceptance Rate is a red flag that demands investigation. It means your pipeline is working, but something is breaking down at the final moment. The root causes are almost always one of three things: compensation misalignment, a poor candidate experience during the process, or a weak Employee Value Proposition (EVP).
In 2026’s talent market, where candidates research companies obsessively on Glassdoor, LinkedIn, and social media before and during the interview process, even a technically competitive offer can lose to a competitor with stronger employer brand signals.
How to calculate it:
Offer Acceptance Rate = (Number of Offers Accepted divided by Number of Offers Extended) multiplied by 100
A healthy Offer Acceptance Rate is generally 85 to 90% or above. Below 80% warrants immediate investigation. Below 70% is a crisis.
How to track it effectively in 2026: The raw rate is useful, but the real intelligence lives in the decline data. Build a systematic process for capturing why candidates decline, through both exit surveys and direct recruiter conversations. Categorize decline reasons such as compensation, competing offer, process experience, role concerns, and location, then track these trends over time. This data is a direct signal from your talent market about your competitive positioning.
Quick win: Conduct salary benchmarking at the start of a search, not when you’re about to make an offer. Compensation misalignment that could have been resolved at the job description stage shouldn’t be discovered in the final stage of negotiation.
Related resources: Track how many interviews turn into real offers using Testlify’s free job offer acceptance rate calculator
KPI #6: Source of hire
Definition: The attribution of each successful hire to the channel or source through which that candidate entered your pipeline.
Why it matters: Not all sourcing channels are created equal. Some channels flood your pipeline with applications but produce few hires. Others generate modest volume but consistently high-quality candidates. Source of Hire analysis is how you allocate your recruiting budget intelligently rather than habitually.
In 2026, most organizations are spreading sourcing spend across 8 to 12 channels simultaneously. Without rigorous source attribution data, that budget allocation is largely guesswork.
How to calculate it:
Source of Hire % = (Hires from Source X divided by Total Hires) multiplied by 100
Track this both by volume (how many hires came from this source?) and by quality (what is the average Quality of Hire score for hires from this source?). The combination of both dimensions is where the real strategic insight lives.
How to track it effectively in 2026: Use UTM parameters for all digital sourcing links to ensure clean attribution in your ATS. Build a consistent source taxonomy that all recruiters use. Conduct quarterly source performance reviews that look at cost, volume, and quality together.
The emerging best practice in 2026 is multi-touch attribution, recognizing that candidates often interact with multiple channels before applying. A candidate might discover you on LinkedIn, research you on Glassdoor, and apply through your careers page. Credit all three touchpoints.
Quick win: Run a simple analysis asking what percentage of your hires over the last 12 months came from employee referrals.
For most organizations, referrals produce 30 to 50% of hires while consuming a fraction of the sourcing budget, and they consistently score higher on Quality of Hire metrics. If your referral program is underperforming, that’s low-hanging fruit worth investing in immediately.
Related resources: Identify the most cost-effective hiring channels using our free sourcing channel efficiency calculator
KPI #7: Candidate experience score
Definition: A quantified measure of how candidates perceive your recruitment process, from initial application through to offer or rejection.
Why it matters: Candidate experience is a business metric masquerading as an HR metric. Every candidate who interacts with your company forms an opinion about your brand. A positive experience creates advocates, people who recommend your company to their network, regardless of whether they received an offer.
A negative experience creates detractors, people who share poor reviews on Glassdoor, warn colleagues away from applying, or simply never do business with your company as a customer again.
In consumer-facing industries, especially, the candidate pool and the customer base overlap significantly. Your recruitment experience is your brand experience.
How to calculate it: The most reliable approach is a Net Promoter Score (NPS) adapted for candidates. Ask candidates: “On a scale of 0 to 10, how likely are you to recommend [Company] to a friend or colleague as a place to apply?” Scores of 9 to 10 are Promoters, 7 to 8 are Passives, and 0 to 6 are Detractors.
Candidate NPS = % Promoters minus % Detractors
Supplement the NPS with stage-specific surveys after the application acknowledgment, after interviews, and after the offer stage to identify which touchpoints are driving positive or negative sentiment.
How to track it effectively in 2026: Automate survey delivery at each stage of the candidate journey through your ATS or CRM. Set a minimum response threshold before drawing conclusions; aim for 100 or more responses per analysis period.
Review results monthly, segment by role type and interviewer, and most importantly, act on the data visibly, because candidates and employees notice when feedback leads to change.
Quick win: Implement a structured rejection communication process. The majority of negative candidate experience reviews are driven not by the rejection itself, but by how the rejection was communicated, or by the complete absence of any communication at all. A respectful, timely rejection message costs nothing and dramatically improves your Candidate NPS.
Building a recruitment KPI dashboard that actually gets used
A dashboard that lives untouched in a shared drive is not a dashboard. It’s a digital paperweight. The most effective recruitment KPI dashboards we’ve seen share three characteristics.
They’re audience-specific: Your executive dashboard covering Time to Fill, Cost Per Hire, and Quality of Hire trends looks nothing like your operational recruiter dashboard covering daily pipeline movements, stage conversion rates, and offer status. Build for the audience, not for completeness.
They’re actionable, not just informational: Every metric on the dashboard should have a clear owner, a defined target, and a visible traffic light status showing whether it is on track, at risk, or off track. If a number doesn’t trigger a decision or an action, question whether it belongs on the dashboard at all.
They’re reviewed on a cadence, not on demand: The most effective TA teams I’ve worked with have a standing weekly data review, 30 minutes every Monday, where the team reviews key operational metrics and flags anything requiring intervention. Monthly, they review strategic KPIs. Quarterly, they review the KPI framework itself.
Common recruitment KPI mistakes (and how to avoid them)
After years of observing talent acquisition teams at all levels of sophistication, these are the mistakes we have witnessed most consistently:
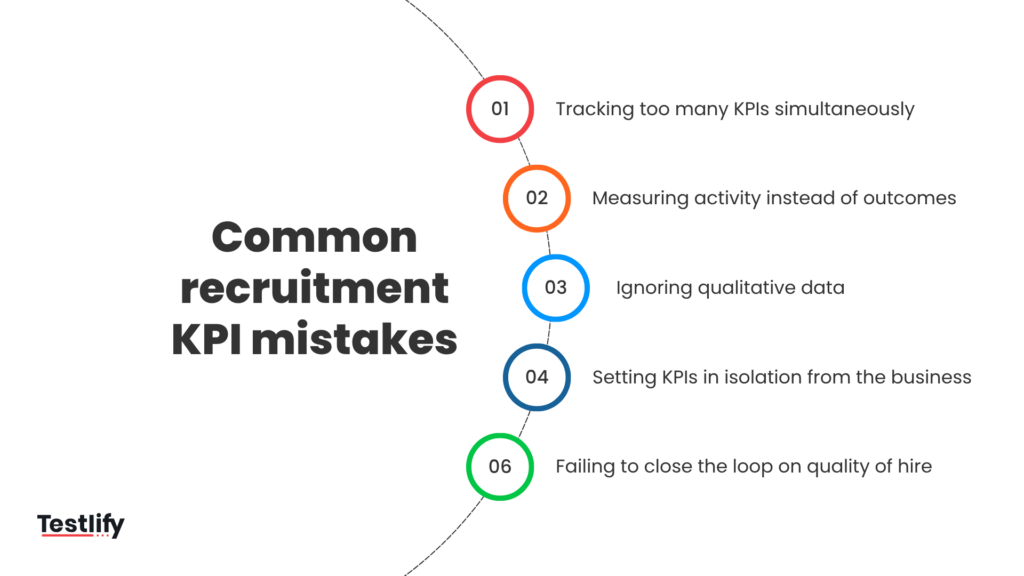
Tracking too many KPIs simultaneously
There is an inverse relationship between the number of KPIs a team tracks and the number of KPIs they actually act on. Choose 5 to 7 that genuinely drive behavior and measure them obsessively. Everything else is noise.
Measuring activity instead of outcomes
“Interviews conducted” is not a KPI. “Interview-to-offer conversion rate” is. “LinkedIn messages sent” is not a KPI. “Response rate by sourcing message template” is. The discipline is always to ask: what does this number actually tell us about results?
Ignoring qualitative data
Your hiring managers, candidates, and new hires are telling you exactly what’s working and what isn’t, through feedback forms, exit conversations, and Glassdoor reviews. Quantitative KPIs tell you what is happening; qualitative data tells you why. Both are essential.
Setting KPIs in isolation from the business
Recruitment KPIs set without explicit alignment to business goals are just HR housekeeping. Every KPI should have a visible connection to a business objective, whether that’s growth targets, retention goals, cost management, or capability building.
Failing to close the loop on quality of hire
Most recruitment teams measure the process up to the hire. Exceptional teams measure the outcome of the hire at 90 days, 6 months, and 12 months in. The data gap between these two measurement points is where the most valuable hiring insights are hiding.
Ready to hire people who actually perform?
The future of recruitment belongs to practitioners who treat talent acquisition as a science, not a process. It belongs to recruiters who can walk into a boardroom and say, with data behind them, “Here is exactly how our hiring is performing, here is what it’s costing and delivering, and here is what we’re changing to make it better.”
The recruiters and talent acquisition leaders who will win in 2026 are the ones who close the loop between candidate assessment and hiring outcomes.
Here’s a truth that most recruiters intuitively know: traditional hiring signals such as resumes, job titles, and years of experience are weak predictors of actual job performance. Skills are not.
Testlify is the talent assessment platform built for exactly this moment in recruiting. It helps you evaluate candidates on the skills that actually predict on-the-job success.
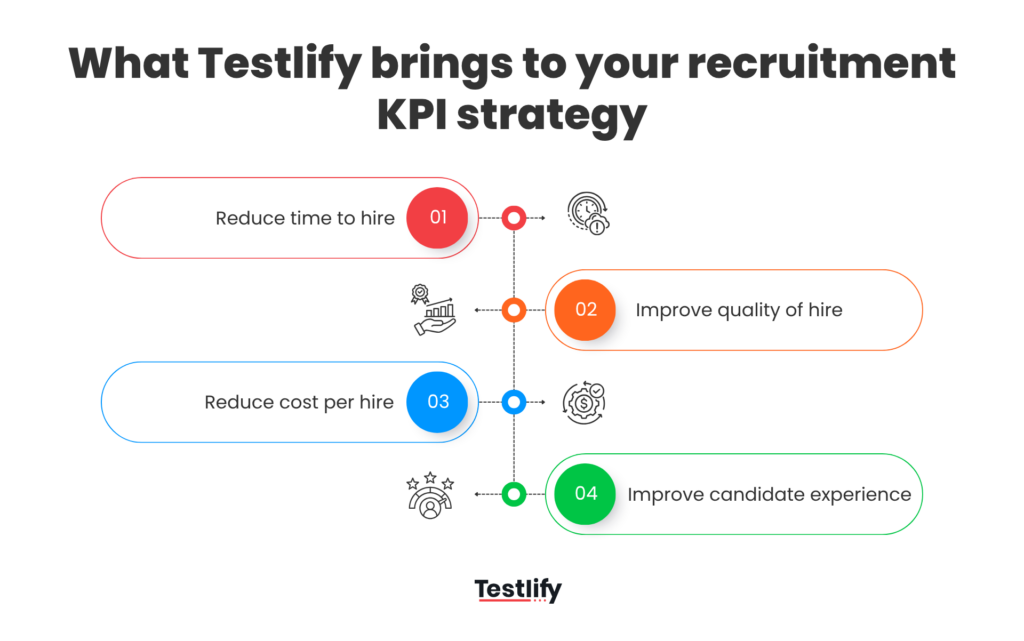
Here’s what Testlify brings to your recruitment KPI strategy:
- Reduce Time to Hire with automated, role-specific assessments that screen candidates at scale, without requiring hours of manual review.
- Improve Quality of Hire by measuring the skills, cognitive ability, and role readiness that resume screening simply can’t capture.
- Reduce Cost Per Hire by filtering out mismatched candidates earlier in the funnel, before your hiring managers invest time in interviews that will never result in a good hire.
- Improve Candidate Experience with engaging, mobile-optimized assessments that candidates actually respect, because being evaluated on ability rather than pedigree feels fair.
With 3,500+ science-backed tests across technical, cognitive, and behavioral dimensions, Testlify gives your recruitment team the assessment infrastructure to make every KPI on this list measurably better.
The best recruitment teams don’t just track performance. They build it from the first assessment.
Book a demo with Testlify today and see how skills-based assessment can transform your recruitment KPIs in 2026.
Frequently asked questions (FAQs)