
20 HR metrics to track in 2026, with formulas and examples
20 HR metrics for hiring, retention, productivity and learning, each with a formula, plus how to pick a starter set and report it well.

HR metrics are the numbers that show how well an organization hires, keeps, develops and pays its people: time to fill, cost per hire, turnover rate, absenteeism and the like. Tracked over time, they tell HR leaders where a people problem is starting, what a program is worth and where the next dollar should go. This guide lists 20 HR metrics with the formula for each, current benchmarks from SHRM, BLS and Gallup, and a simple way to choose the 8 to 10 that matter for your team.
TL;DR / Key takeaways
- HR metrics are measurable numbers, such as time to fill, cost per hire and turnover rate, that show how well a company hires, keeps and develops people.
- Group them in four areas: recruiting and hiring, retention and engagement, workforce and productivity, and learning and development.
- Start with 8 to 10 metrics tied to real business questions. Tracking all 20 at once produces reports nobody acts on.
- Current benchmarks: SHRM puts median time to fill at 39 days for nonexecutive roles, BLS puts the 2025 US absence rate at 3.2%, and Gallup puts global engagement at 20%.
- Quality of hire is the metric most teams skip and the one leaders care about most. Link pre-hire skills scores to 90-day performance to measure it.
- Report a short executive set monthly or quarterly, always as a trend with a target, never as a single number.
 ChatGPT
 Gemini
 Claude
 Grok
 Perplexity
What are HR metrics?
HR metrics are quantitative measures of the people side of a business, such as how long hiring takes, what it costs, how many people leave and how productive the workforce is. Each one is a number with a fixed formula, tracked over a set period, so HR can compare month to month and spot change early.
A metric on its own only describes what happened. HR analytics is the next step: combining several metrics to explain why it happened and what is likely next. A turnover rate of 18% is a metric. Finding that most of those leavers came from one source, one manager or one quarter is analytics.
Good human resources metrics share three traits:
- A fixed formula: Everyone calculates the number the same way, every period.
- A clear owner: Someone is responsible for moving it.
- A decision behind it: If the number goes up or down, the team knows what it will do next.

Why do HR metrics matter?
HR metrics matter because people costs are usually the largest line in the budget, and leadership expects HR to manage them with the same data finance uses. Metrics let HR show the cost of a problem, prove a program worked, and catch issues such as rising early turnover before they reach the board.
The cost of getting people decisions wrong is large. The Gallup State of the Global Workplace report found that global employee engagement fell to 20% in 2025, down from 23% in 2022, and that low engagement cost an estimated $10 trillion in lost productivity in 2024. Manager engagement dropped from 27% to 22% in a single year.
For HR and talent acquisition teams, metrics do four jobs:
- Spot problems early: A rise in first-year turnover or a fall in offer acceptance shows up in the data weeks before it shows up in exit interviews.
- Prove value: A drop in cost per hire after a sourcing change is evidence that the change worked.
- Set priorities: Metrics show which of ten possible fixes will move the number the business cares about.
- Earn a seat at the table: CFOs and CEOs trust numbers they can trend and compare.
What are the key HR metrics to track?
The key HR metrics fall into four areas: recruiting and hiring, retention and engagement, workforce and productivity, and learning and development. The 20 below cover what most mid-size and enterprise HR teams need. Use the table as a cheat sheet, then read the sections that follow for what each one tells you.
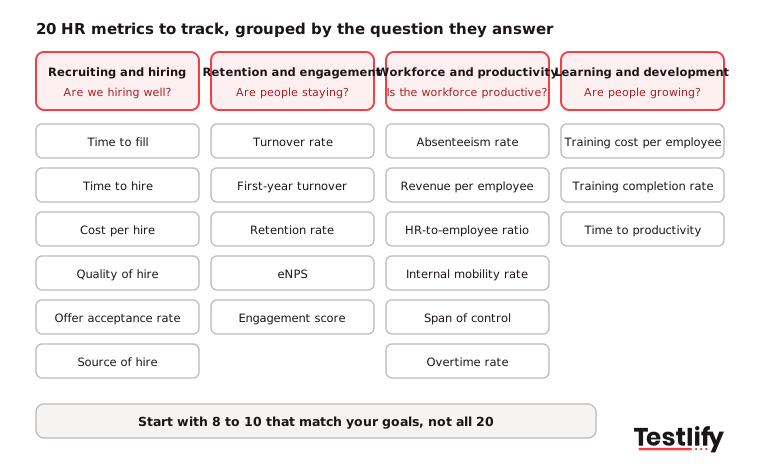

Key takeaway: Pick the area that matches your biggest business problem first. A company losing new hires needs the retention metrics before it needs revenue per employee.
Which recruiting and hiring metrics should HR track?
Recruiting and hiring metrics should cover speed, cost, quality and the candidate's response to the offer. The six below answer the question every CEO asks HR: are we hiring the right people fast enough, at a sensible cost? For how your numbers compare with peers, see these recruiting metrics benchmarks.
1. Time to fill

Time to fill counts the calendar days from the day a requisition is opened to the day a candidate accepts the offer. It measures the whole process, including approvals and sourcing. The latest SHRM recruiting benchmarking data, based on more than 4,600 organizations, puts the median at 39 calendar days for nonexecutive roles. A rising number usually points to slow approvals or a thin pipeline.
2. Time to hire

Time to hire counts the days from the moment a candidate enters your pipeline, by applying or being sourced, to offer acceptance. Time to hire isolates the selection process: screening, interviews and decisions. When time to fill is high but time to hire is normal, the delay sits before candidates arrive. You can check your own figure with the average time to hire calculator.
3. Cost per hire

Cost per hire adds internal costs (recruiter time, referral bonuses, interviewer hours) and external costs (job ads, agencies, assessment tools, background checks), then divides by the number of hires in the same period. SHRM's benchmarking shows executive cost per hire rising while nonexecutive cost stays roughly flat. Track it by role family, since one executive search can distort the average. The cost per hire calculator does the sum for you.
4. Quality of hire
Quality of hire shows whether new hires perform and stay. No single standard formula exists, so most teams average three or four indicators measured at 90 days and 12 months, such as performance rating, hiring manager satisfaction and 12-month retention. Fix the indicators before you start and never change them mid-year. This guide on how to improve quality of hire covers the levers, and the quality of hire calculator gives a starting score.
5. Offer acceptance rate
Offer acceptance rate divides offers accepted by offers extended, times 100. A falling rate usually means pay is below market, the process took too long or the candidate experience put people off. Segment it by role and by recruiter to find where the drop happens. Use the job offer acceptance rate calculator to check your figure.
6. Source of hire
Source of hire shows the share of hires that came from each channel: job boards, referrals, careers site, agencies, internal moves. On its own it rewards volume. Pair it with quality of hire and cost per hire by source, so you invest in the channels that bring people who perform, not just people who apply.
Which retention and engagement metrics matter most?
Retention and engagement metrics matter most when they separate who leaves, when they leave and how the people who stay feel. Turnover rate, first-year turnover, retention rate, eNPS and engagement score together show whether the company keeps the people it worked hard to hire.
For context, US government data shows how much movement is normal. The BLS Job Openings and Labor Turnover Survey reported a quits rate of 2.1% and a total separations rate of 3.3% for September 2026. Compare your monthly figures with your own industry, not the national average.
7. Turnover rate
Turnover rate divides separations in a period by average headcount, times 100. Average headcount is (headcount at start + headcount at end) / 2. Split it into voluntary and involuntary turnover, and into regretted and non-regretted leavers, because a 15% rate means something very different if most leavers were low performers. The attrition rate calculator handles the math.
8. First-year turnover
First-year turnover divides new hires who left within 12 months by all new hires from the same period. A high figure points to a hiring or onboarding problem rather than a culture problem: the role was mis-sold, the wrong skills were tested or onboarding was thin. First-year turnover is the clearest early warning of poor quality of hire.
9. Retention rate
Retention rate is the share of employees at the start of a period who are still employed at the end. New hires made during the period are left out, so the number is not simply 100 minus turnover. Track it for high performers and critical roles separately, since those are the leavers that hurt most.
10. Employee net promoter score (eNPS)
The employee net promoter score asks one question: how likely are you to recommend this company as a place to work, on a scale of 0 to 10? Subtract the share of detractors (0 to 6) from the share of promoters (9 to 10). The result runs from minus 100 to plus 100. The free eNPS calculator works it out from your survey counts.
11. Engagement score
Engagement score is the share of favorable answers on a set of survey items about commitment, clarity and support. Use the same survey items every cycle, report participation alongside the score, and break results down by manager. Gallup's data above shows why managers matter: their engagement drives the team's.
Which workforce and productivity metrics should HR report?
Workforce and productivity metrics show whether the organization has the right number of people, in the right structure, working at a sustainable pace. Absenteeism, revenue per employee, HR-to-employee ratio, internal mobility, span of control and overtime are the six most HR teams report to finance and operations leaders.

12. Absenteeism rate
Absenteeism rate divides unplanned absence days by scheduled workdays, times 100. Leave out planned holidays and approved leave. Data from the US Bureau of Labor Statistics puts the 2025 absence rate for full-time wage and salary workers at 3.2%, with a lost worktime rate of 1.7%. A rising rate in one team often signals workload or management issues.
13. Revenue per employee
Revenue per employee divides total revenue by average FTE headcount. The trend matters more than the absolute figure, which varies widely by industry. Use FTE rather than raw headcount, so part-time staff do not distort the number.
14. HR-to-employee ratio
HR-to-employee ratio divides HR FTEs by total employees, usually shown as HR staff per 100 employees. Larger organizations tend to run leaner ratios because of shared services and HR technology. Use it to plan HR capacity, not as a target on its own.
15. Internal mobility rate
Internal mobility rate divides promotions and lateral moves by average headcount, times 100. A healthy rate cuts hiring costs and keeps people who would otherwise leave for growth. This guide to internal mobility covers how to build it up.
16. Span of control
Span of control is the average number of direct reports per people manager. Very narrow spans add cost and layers. Very wide spans leave managers no time to coach, which shows up later in engagement and turnover.
17. Overtime rate
Overtime rate divides overtime hours by total hours worked, times 100. Sustained high overtime in one team is an early sign of understaffing and burnout, and often comes before a rise in absence and turnover.
Which learning and development metrics are worth tracking?
Learning and development metrics are worth tracking when they link training to skills and performance, not just attendance. Training cost per employee shows investment, training completion rate shows follow-through, and time to productivity shows whether onboarding and early training actually get new hires up to speed.
18. Training cost per employee
Training cost per employee divides total L&D spend, including tools, vendors and internal trainer time, by headcount. Compare it with performance and internal mobility over time. Spend that never shows up in either is worth questioning.
19. Training completion rate
Training completion rate divides completions by enrollments, times 100. A low rate usually points to irrelevant content or no time to learn. A high rate alone proves little, so pair it with a skills check before and after the course.
20. Time to productivity
Time to productivity counts the days from a new hire's start date to an agreed milestone, such as a full sales quota or a first independent release. Agree the milestone per role with the hiring manager at the time of hire. Shorter time to productivity is often the biggest financial gain from better hiring.
How do you choose the right HR metrics?
The right HR metrics are the ones that answer a business question someone will act on. Start from the question, choose one metric that answers it, set a baseline and target, name an owner and a review cadence, and pair it with a leading metric that warns you before the main number moves.
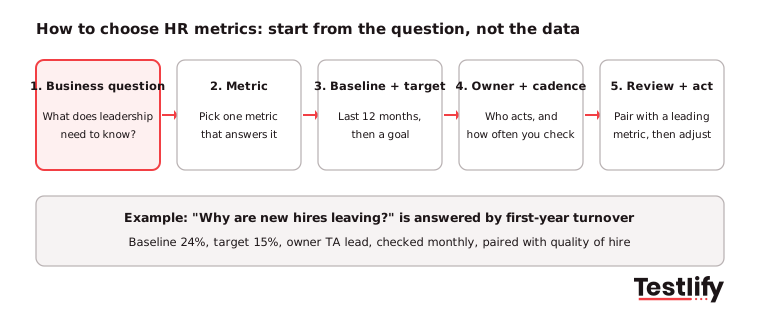
- Start with the question: "Why are new hires leaving?" leads to first-year turnover. "Is hiring too slow for the sales plan?" leads to time to fill for sales roles.
- Choose one metric per question: Two metrics that answer the same question split attention.
- Set a baseline and target: Use the last 12 months as the baseline, then agree a realistic target.
- Name an owner and cadence: Someone must act when the number moves, and everyone must know how often it is checked.
- Pair lagging with leading: Turnover is a lagging metric. Engagement score, offer acceptance rate and first-year turnover lead it.
Pro tip: Most teams need 8 to 10 metrics, not 30. A good starter set is time to fill, cost per hire, quality of hire, offer acceptance rate, turnover rate, first-year turnover, eNPS, absenteeism rate and revenue per employee. For a longer list of goal-linked measures, see these HR KPIs.
Which HR metrics should you report to leadership?
The HR metrics to report to leadership are the few that tie directly to cost, growth and risk: headcount against plan, time to fill for critical roles, cost per hire, quality of hire, turnover (especially regretted and first-year), engagement or eNPS and revenue per employee. Show each as a trend against a target, with one line on what HR is doing about it.
A practical reporting rhythm looks like this:
Audience | Metrics | Cadence |
|---|---|---|
Board or CEO | Headcount vs plan, regretted turnover, engagement, revenue per employee | Quarterly |
CFO | Cost per hire, HR cost per employee, overtime rate, revenue per employee | Monthly or quarterly |
Hiring managers | Time to fill, time to hire, offer acceptance, quality of hire | Monthly |
TA and HR team | All recruiting metrics by role, source and recruiter | Weekly |
An HR metrics dashboard should pull data from your ATS and HRIS automatically, so the numbers stay current and nobody rebuilds a spreadsheet every month. Internal HR benchmarking then adds context: how this year compares with last year and with peers.
What are the most common HR metric mistakes?
The most common HR metric mistakes are inconsistent formulas, missing context and tracking numbers nobody acts on. Several popular guides even print the turnover and absenteeism formulas upside down. Check these traps before your next report goes out:
- Inverted formulas: Turnover is separations divided by average headcount, not the other way round. Absenteeism is absence days divided by scheduled days.
- Wrong average headcount: Average headcount is (start + end) / 2. Using only the end-of-period figure inflates turnover in a growing company.
- Mixed definitions: Time to fill and time to hire are different metrics. Decide which one you report and keep the start date fixed.
- No segmentation: A company-wide average hides the one team or role driving the problem.
- Speed without quality: A falling time to hire is only good news if quality of hire and first-year turnover hold steady.
- Vanity metrics: Applications received or courses launched look busy but drive no decision.
- Too many numbers: A 40-metric report gets skimmed. Ten metrics with commentary get read.
How can skills assessments improve your hiring metrics?
Skills assessments improve hiring metrics by adding objective evidence at the screening stage, which is where most quality-of-hire problems begin. When every candidate takes the same role-based test, you can link pre-hire scores to 90-day performance and first-year turnover and see which skills actually predict success in the role.
Testlify supports this in a few practical ways:
- Role-based tests: A library of 3,500+ tests covers technical, cognitive, language, situational judgment and personality skills, so screening matches the role, not the resume. Browse the test library.
- Faster shortlists: Automated scoring ranks candidates on the same criteria, which cuts screening time and helps time to hire.
- Reporting you can use: Per-skill breakdowns, benchmarking and drop-off reports feed directly into your hiring metrics. See reporting and analytics.
- ATS sync: Scores flow back to 100+ ATS and HRIS tools, so assessment data sits next to the rest of your HR data.
Hiring for the HR team itself? The HR analytics skills test checks whether candidates can build and read these metrics.
Ready to measure quality of hire from day one?
Better HR metrics start with better hiring data. Start a 7-day free trial of Testlify, no credit card required, and build a role-based assessment from your own job description in minutes. Every candidate gets scored on the same skills, so your quality of hire has evidence behind it from the first day.
Frequently asked questions

Content Writer
Yashika Khandelwal is a Content Writer with 3+ years of experience creating research-backed content on hiring, talent assessment, and HR technology. She is a registered Organizational Psychologist and subject matter expert who combines behavioral science with practical recruitment insights to produce accurate, evidence-based content.
LinkedInRelated resources
View all
HR & recruitment
What is competency mapping and how can organizations implement it?

HR & recruitment
HR mistakes to avoid: 12 costly errors and how to fix them

HR & recruitment
12 onboarding ideas to welcome new employees

HR & recruitment
20 Best Job Boards for Hiring in 2026 (Free and Paid)

HR & recruitment
Hiring process steps you should never skip

HR & recruitment
12 Executive Leadership Skills That Define C-Suite Performance (And How to Assess Them)
Get started.
Hire on proof, not resumes.
Run your first skills-based assessment free — no credit card required.