
How to measure employee productivity: metrics, formulas and steps
Simple formulas, role-based metrics and a 6-step process to measure employee productivity fairly, plus how to use the data to hire better.

To measure employee productivity, compare the useful output a person or team delivers with the input it took, usually hours worked or cost, and check the quality of that output against clear goals. The most reliable approach mixes three things: an output measure (units, tickets, deals, projects), a quality measure (errors, customer scores, rework) and progress on agreed goals.
TL;DR / Key takeaways
- Employee productivity is output divided by input. The basic formula is total output / total hours worked, and revenue per employee works at company level.
- Measure outcomes, not activity. Hours online, keystrokes and mouse movement show presence, not results.
- Use 3 to 5 metrics per role, always pairing a quantity metric with a quality metric so speed never hides poor work.
- Set a baseline first, compare people only with peers in the same role, and review the numbers monthly or quarterly.
- Engagement drives output: Gallup puts the cost of low engagement at about $10 trillion in lost productivity worldwide.
- The same productivity data tells hiring teams what a strong performer looks like, so you can test candidates for it and judge quality of hire.
 ChatGPT
 Gemini
 Claude
 Grok
 Perplexity
What is employee productivity?
Employee productivity is the amount of useful work an employee delivers for the time, effort and cost put in. A support agent who resolves 40 tickets a day at a high customer score is more productive than one who closes 50 tickets that keep coming back.
Economists use the same idea at national level. The US Bureau of Labor Statistics measures labor productivity as output per hour worked, and prefers hours to headcount because hours capture part-time work and time off. By that measure, US nonfarm business productivity rose 2.1% in 2025, with output up 2.5% and hours up only 0.4%, according to the BLS release of March 24, 2026.
Inside a company, productivity has two parts:
- Efficiency: how much output you get for each hour or dollar.
- Effectiveness: whether that output is the right work, at the right quality, moving the goals that matter.
Good measurement covers both. A team can be very efficient at work nobody needs.

Why should you measure employee productivity?
Companies measure employee productivity to see where work gets stuck, to set fair goals, to plan headcount and to spot people who need support or recognition. Without a measure, managers fall back on gut feel and visibility, which rewards whoever is loudest or online longest.
The business stakes are large. Gallup's State of the Global Workplace report found global employee engagement fell to 20% in 2025, and manager engagement dropped to 22%. Gallup puts the cost of low engagement at about $10 trillion in lost productivity, roughly 9% of global GDP.
Measuring well helps you:
- Find blockers: slow approvals, bad tools or unclear priorities show up as dips across a whole team.
- Plan headcount: output per person tells you whether you need more people or better processes.
- Coach fairly: clear numbers make performance reviews about results, not impressions.
- Hire better: you learn what top performers do differently, which becomes the bar for new hires.
How do you calculate employee productivity?
Employee productivity is calculated by dividing output by input: Productivity = Output / Input. Output is whatever the role produces (units, sales, tickets, projects). Input is usually hours worked, number of employees or labor cost. Pick the version that fits the work and keep it the same over time.
Three formulas cover most needs:
Formula | Calculation | Worked example | Best for |
|---|---|---|---|
Labor productivity | Output / hours worked | 1,200 orders packed in 160 hours = 7.5 orders per hour | Warehouses, manufacturing, contact centers |
Revenue per employee | Revenue / number of employees | $20M revenue / 115 employees = about $174,000 per employee | Company-wide trends, benchmarking |
Goal completion rate | Goals completed / goals set x 100 | 8 of 10 quarterly goals met = 80% | Knowledge work, projects, managers |
For context on revenue per employee, the SHRM 2025 CHRO benchmarking data found median revenue per full-time equivalent reached almost $173,000, the highest figure in that research since 2017.
Pro tip: Use hours actually worked, not hours paid, when you can. Paid hours include leave and holidays, which makes a team on vacation look unproductive.
What metrics measure employee productivity?
Employee productivity metrics fall into five groups: quantity, quality, efficiency, goal outcomes and engagement. One metric alone is easy to game, so most teams pick one or two from each of the first three groups and add goal progress, then watch engagement as an early warning sign.
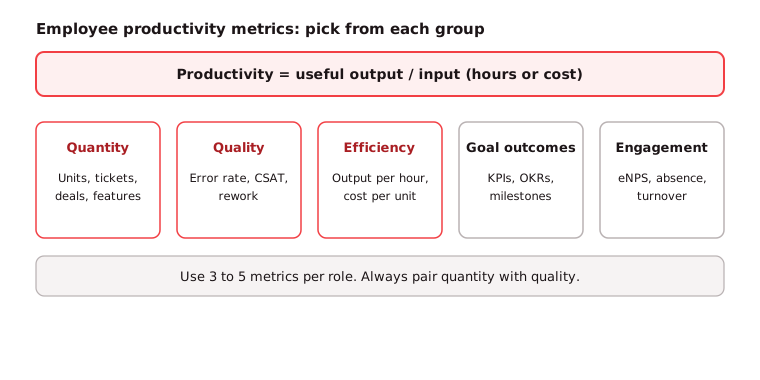
- Quantity: units produced, tickets resolved, calls handled, deals closed, features shipped.
- Quality: error or defect rate, rework, customer satisfaction (CSAT), first-contact resolution, peer review scores.
- Efficiency: output per hour, cost per unit, average handling time, cycle time, utilization of billable hours.
- Goal outcomes: progress on key performance indicators (KPIs) and objectives and key results (OKRs), project milestones hit on time.
- Engagement and health: absenteeism, turnover, employee net promoter score (eNPS), survey results.
Engagement metrics do not measure output directly, but they move first. A drop in eNPS or a rise in sick days often shows up a quarter before output falls. For more on that link, see how engagement affects productivity and profit.
How do you measure employee productivity step by step?
You measure employee productivity in six steps: define what good output looks like for each role, choose 3 to 5 metrics, set a baseline, collect data from the systems you already use, review it in context with the employee, and act on what you find. Repeat the cycle every quarter.
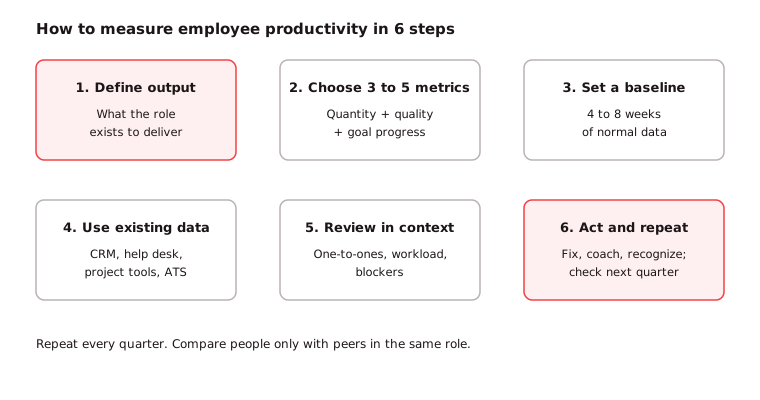
- Define output per role: Write down what a role exists to deliver. For a recruiter it is quality hires on time; for a developer it is working features; for a sales rep it is revenue.
- Choose 3 to 5 metrics: Pair at least one quantity metric with one quality metric, and add goal progress. More than five and nobody remembers them.
- Set a baseline: Collect 4 to 8 weeks of data before you set targets. The baseline shows what normal looks like for your team, not an industry average.
- Use the data you already have: Your CRM, help desk, project tool, ATS and HRIS already record most outputs. Avoid adding tracking software just to count activity.
- Review in context: Discuss the numbers in one-to-ones. Workload, sick leave, a new tool or a hard client can explain a dip. Fold the review into your performance management cycle.
- Act and repeat: Remove blockers, adjust goals, coach or recognize people, then check the same metrics next quarter.
Which productivity metrics fit which roles?
Productivity metrics should match what each role produces. Sales roles suit revenue and win rate, support roles suit resolution and satisfaction, engineering suits delivery and quality, and operations suits units per hour and errors. Using one metric for every team gives misleading comparisons and pushes people toward the wrong behavior.
Role | Quantity metric | Quality metric | Watch out for |
|---|---|---|---|
Sales | Revenue, deals closed, pipeline created | Win rate, deal size, churn of new customers | Discounting to hit volume |
Customer support | Tickets resolved per hour | CSAT, first-contact resolution, reopen rate | Closing tickets too fast |
Software engineering | Features or stories delivered, cycle time | Bugs in production, review feedback | Counting lines of code or commits |
Operations and warehouse | Units per hour, orders processed | Error rate, safety incidents | Burnout from pace targets |
Recruiting | Hires per recruiter, time to fill | Hiring manager satisfaction, new hire retention | Speed at the cost of quality of hire |
Knowledge work and managers | Goals or projects completed on time | Stakeholder feedback, team results | Rewarding busy work and long hours |
For frontline and shift teams, see our guide to measuring blue-collar worker productivity.
What is the difference between measuring and monitoring productivity?
Measuring productivity looks at the results people deliver; monitoring looks at the activity they perform, such as time online, keystrokes, apps used or screenshots. Results tell you whether work is getting done well. Activity tells you only that someone was busy, and heavy tracking can lower trust and output.
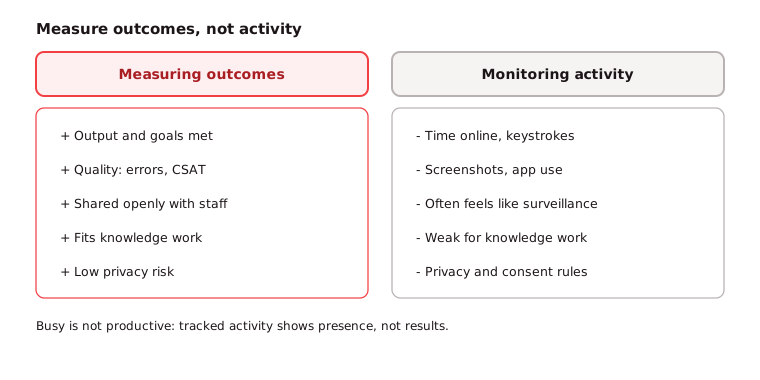
Busy is not the same as productive. Microsoft's 2025 Work Trend Index research found Microsoft 365 users are interrupted about every two minutes, around 275 times a day, by meetings, emails and chats. A tracker would log all of that as activity, yet it is the main thing stopping focused work.
If you do use monitoring tools, tell employees what you collect and why, collect only what you need, and use the data to fix workflows rather than to punish people. Our guide on AI in employee monitoring covers the trade-offs.
What mistakes should you avoid when measuring productivity?
The most common mistakes are counting hours instead of results, using one formula for every role, ignoring quality, comparing people across different roles, and collecting data nobody acts on. Each one makes the numbers look precise while pointing managers at the wrong problem.
- Measuring hours, not outcomes: long hours often mean poor processes, not high output.
- Ignoring quality: volume targets without a quality check reward rushed, error-prone work.
- One size for all roles: an engineer and a sales rep cannot share a metric.
- No baseline: targets copied from another company or an old year rarely fit your team.
- Hiding the numbers: people improve faster when they can see their own data.
- Not acting: if a metric never changes a decision, stop collecting it.
Key takeaway: Measure a few outcome metrics per role, pair quantity with quality, share the data openly and review it in context. Activity tracking is a poor substitute for knowing what good output looks like.
How can you improve employee productivity once you measure it?
Employee productivity improves fastest when you remove what slows people down before asking them to work harder. Use your data to find the cause of low output (unclear goals, too many meetings, weak tools, skill gaps or low engagement) and fix that cause directly.
- Clarify goals: people who know the two or three things that matter waste less time.
- Protect focus time: cut recurring meetings and set quiet hours for deep work.
- Close skill gaps: test current skills, then train for the gaps that hold back output.
- Fix tools and handoffs: many dips come from slow approvals or poor systems, not people.
- Recognize good work: recognition is cheap and keeps engaged people engaged.
How does productivity data help you hire better?
Productivity data helps you hire better by showing what your best performers actually do, so you can screen candidates for those skills and later check whether new hires reach the same output. That turns quality of hire from a gut feeling into a number you can track.
Most talent teams want this but struggle to do it. LinkedIn's Future of Recruiting 2025 found 89% of talent acquisition professionals say measuring quality of hire will become more important, yet only 25% are highly confident they can measure it.
The most common measures are job performance ratings (66%), new hire retention (60%) and hiring manager satisfaction (44%), and 93% say assessing skills accurately is crucial to quality of hire.
Across the teams we work with, the useful pattern looks like this:
- Profile top performers: use your productivity metrics to find the top 20% in a role, then list the skills and behaviors they share.
- Test for those skills: build an assessment around them so every candidate is judged on the same criteria.
- Track time to productivity: measure how long new hires take to reach the team's baseline output.
- Close the loop: compare assessment scores with 6- and 12-month productivity, and adjust what you test.
For a fuller playbook, read how to improve quality of hire or try the quality of hire calculator.
How can Testlify help?
Testlify helps hiring teams turn what top performers do into skills tests, so new hires start closer to the productivity bar. You pick or build an assessment for the role, every candidate takes the same test, and you shortlist on scored evidence instead of resumes.
- Role-based tests: 3,500+ tests covering role-specific skills, software, coding, cognitive ability, situational judgment and language, in Testlify's test library.
- Custom assessments: the AI test builder creates a role-specific assessment from your job description, with 25+ question types including practical tasks and simulations.
- Benchmarks and reports: automated scoring, per-skill breakdowns and benchmarking let you compare candidates against each other and against your own standard. See reporting and analytics.
- Fits your stack: results sync with 100+ ATS and HRIS tools, so assessment scores can sit next to later performance data.
Ready to hire people who hit the bar faster?
Start a 7-day free trial of Testlify, no credit card required, or browse the test library to find an assessment for the role you are hiring next.
Frequently asked questions

Content Writer
Yashika Khandelwal is a Content Writer with 3+ years of experience creating research-backed content on hiring, talent assessment, and HR technology. She is a registered Organizational Psychologist and subject matter expert who combines behavioral science with practical recruitment insights to produce accurate, evidence-based content.
LinkedInRelated resources
View all
HR & recruitment
Gig worker challenges employers face, and how to manage them

HR & recruitment
What are the benefits of using a PEO? A guide for growing teams

HR & recruitment
PEO for startups: what it does and when it pays off

HR & recruitment
Labor forecasting: what it is and how to do it in 2026

HR & recruitment
Payroll advance: what it is, how it works and how to offer one

HR & recruitment
How to evaluate team performance: a practical guide for 2026
Get started.
Hire on proof, not resumes.
Run your first skills-based assessment free — no credit card required.