
Employee engagement metrics: 12 to track and how to measure them
The 12 employee engagement metrics worth tracking, with formulas, a six-step way to measure them and the signals that matter for new hires.

Employee engagement metrics are the numbers HR teams use to see how committed, motivated and likely to stay their people are. Some come from surveys, such as an engagement score or eNPS. Others come from HR data, such as voluntary turnover, absenteeism and internal moves. Read together, they show where engagement is strong, where it is slipping, and which teams need attention first.
TL;DR / Key Takeaways
- Engagement metrics combine what people say in surveys (engagement score, eNPS, participation) with what they do (turnover, absence, internal moves, retention).
- Gallup found global engagement fell to 20% in 2025, costing about $10 trillion in lost productivity. Manager engagement dropped from 27% to 22%.
- Track five to eight metrics, and make only three to five of them KPIs with a target and an owner.
- Leading metrics like eNPS move within weeks. Lagging metrics like turnover move after 3 to 12 months. Pair each leading metric with one lagging metric.
- An engagement score of 70% favourable or higher is strong, and under 50% needs action. eNPS above +20 is good, above +40 excellent.
- Read every result by manager. Gallup says managers account for at least 70% of the variance in team engagement.
- For new hires, track 30, 60 and 90-day pulses plus 90-day and 12-month retention, then compare cohorts by hiring source.
 ChatGPT
 Gemini
 Claude
 Grok
 Perplexity
What are employee engagement metrics?
Employee engagement metrics are measurable signals of how involved and committed employees are in their work and their employer. They fall into two groups: what people tell you in surveys (engagement score, eNPS, pulse results) and what people do (stay, leave, show up, move internally, hit goals).
Engagement is not the same as satisfaction. A satisfied employee is content with pay and conditions. An engaged employee puts in discretionary effort and plans to stay. That is why good engagement measurement mixes attitude data with behaviour data.
Metrics and KPIs are also different, although the terms are often used as if they were the same thing.
Engagement metric | Engagement KPI | |
|---|---|---|
What it is | Any number that tracks engagement | A metric with a target and an owner |
Example | eNPS by team | Raise company eNPS from 10 to 20 by Q4 |
How many | As many as the data supports | Three to five at most |
Who uses it | HR and people analytics | Leadership and managers |
Pick a broad set of metrics to understand engagement, then promote a few of them to KPIs that leaders are accountable for. For the wider set of people numbers, see our guide to key HR metrics.

Why do employee engagement metrics matter?
Employee engagement metrics matter because engagement is low, falling, and expensive when ignored. Teams that measure it can spot a struggling department months before resignations arrive, and can show leaders whether the money spent on engagement is working.
The numbers are not encouraging. Gallup's State of the Global Workplace 2026 found that global engagement fell to 20% in 2025, down from a peak of 23% in 2022, and that low engagement costs the world economy about $10 trillion in lost productivity, roughly 9% of global GDP. Manager engagement dropped hardest, from 27% in 2024 to 22% in 2025.
Managers matter because their teams follow them. When the people running teams are disengaged, the drop spreads to everyone who reports to them. Engagement metrics give HR a way to see that spread team by team instead of waiting for an annual survey to confirm it.
What are the most important employee engagement metrics?
The most important employee engagement metrics are the engagement score, eNPS, survey participation, voluntary turnover, retention, absenteeism and new-hire retention. Together they cover what employees say, what they do, and how quickly new joiners settle in. The table below lists 12 metrics with a simple formula for each.
# | Metric | Formula | Signal type |
|---|---|---|---|
1 | Engagement score | Share of favourable answers (4 or 5 on a 5-point scale) across engagement questions | Leading |
2 | Employee Net Promoter Score (eNPS) | % promoters (9 to 10) minus % detractors (0 to 6) | Leading |
3 | Survey participation rate | Completed surveys / employees invited x 100 | Leading |
4 | Pulse score trend | Change in average pulse score since the last pulse | Leading |
5 | Manager engagement gap | Team engagement score minus company engagement score | Leading |
6 | Internal mobility rate | Internal moves / total employees x 100 | Leading |
7 | Goal completion rate | Goals completed / goals set x 100 | Leading |
8 | Absenteeism rate | Unplanned absence days / available workdays x 100 | Lagging |
9 | Voluntary turnover rate | Voluntary leavers / average headcount x 100 | Lagging |
10 | Regrettable turnover rate | Leavers you wanted to keep / total leavers x 100 | Lagging |
11 | Retention rate | Employees still employed at period end who were there at start / headcount at start x 100 | Lagging |
12 | New-hire retention rate | New hires still employed after 90 days (or 12 months) / new hires in the cohort x 100 | Lagging |
A few notes on the ones teams get wrong most often:
- Engagement score: Use the same questions every time, or the trend means nothing. Report it as a percentage favourable, not an average, so managers can read it quickly.
- eNPS: Ask one question: how likely are you to recommend this company as a place to work, on a 0 to 10 scale. Scores run from -100 to +100. Our eNPS glossary entry explains the scale in more detail.
- Survey participation: Low participation is a metric in its own right. People who have checked out often skip the survey too.
- Voluntary turnover: Separate it from involuntary exits, or a round of layoffs will hide what is happening. See how to calculate turnover rate by period.
- Absenteeism: Count only unplanned absence. Planned leave is a sign of a healthy team, not a disengaged one. More on absenteeism.
To put your turnover in context, compare it with the national picture. The US Bureau of Labor Statistics JOLTS release reported 3.1 million quits in August 2026, a quits rate of 1.9% for the month.
What is the difference between leading and lagging engagement metrics?
Leading engagement metrics move first and warn you that engagement is changing, while lagging metrics confirm the result months later. Survey scores, eNPS and participation are leading signals. Turnover, absenteeism and retention are lagging signals, because by the time they move, people have already decided.
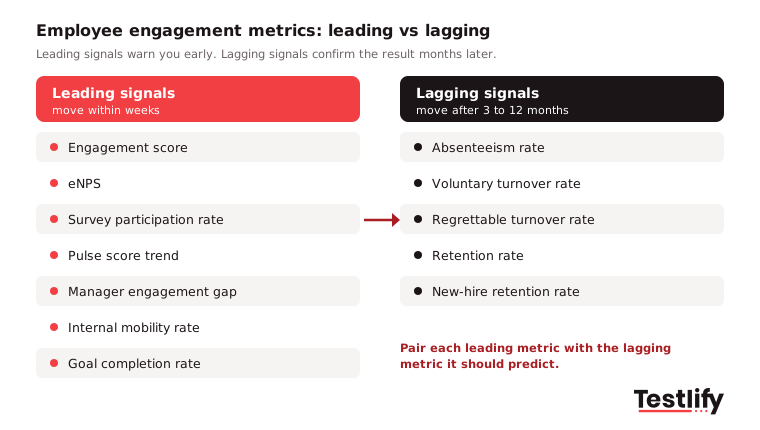
Leading metrics | Lagging metrics | |
|---|---|---|
Examples | Engagement score, eNPS, pulse trend, participation, manager gap | Voluntary turnover, regrettable turnover, absenteeism, retention |
Source | Surveys and HR systems | HRIS and payroll |
Moves | Within weeks | After 3 to 12 months |
Use it to | Act before people leave | Prove that the actions worked |
Risk | Survey fatigue, honest answers depend on trust | Too late to save the people already gone |
Track both. Leading metrics tell managers where to act this quarter. Lagging metrics tell leaders whether last year's actions paid off.
Pro tip: Pair each leading metric with the lagging metric it should predict. If eNPS drops in a team for two pulses in a row, check that team's voluntary turnover three to six months later. Over a year, you will learn which survey signals are worth acting on in your company.
How do you measure employee engagement?
Measuring employee engagement takes six steps: pick a short set of metrics, set a baseline, run a survey, pull the matching HR data, break results down by team and tenure, and act on what you find. The cycle then repeats, usually with a short pulse every quarter.
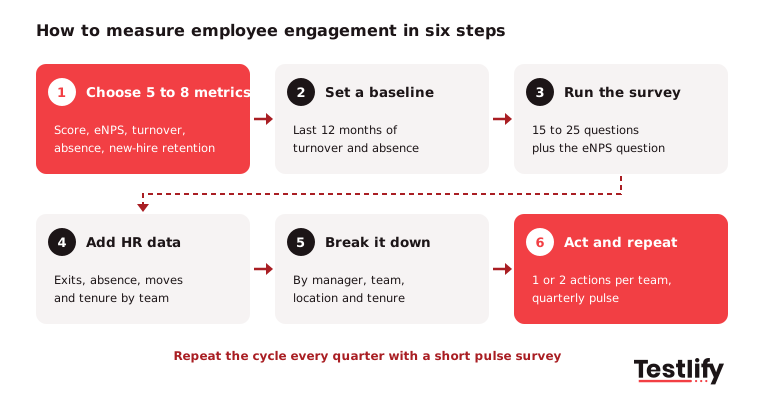
- Choose five to eight metrics: Start with engagement score, eNPS, participation, voluntary turnover, absenteeism and new-hire retention. Add more only when you have a question they cannot answer.
- Set a baseline: Pull the last 12 months of turnover and absence data before you launch anything, so the first survey has something to compare against.
- Run an engagement survey: Keep it to 15 to 25 questions, include the eNPS question, and promise confidentiality you can actually keep (do not report teams smaller than five people).
- Add the behaviour data: Join survey results with HRIS data on exits, absence, internal moves and tenure, at team level.
- Break it down: Look at results by manager, department, location and tenure band. Company averages hide the teams that need help.
- Act and repeat: Share results with managers within two weeks, agree one or two actions per team, and run a short pulse survey every quarter to see if anything moved.
For the survey itself, a short employee onboarding survey works well for new joiners, while a fuller annual survey covers everyone else.
What is a good employee engagement score?
A good employee engagement score is one that beats your own last result and your industry peers, but a common rule of thumb is that 70% favourable or higher is strong and under 50% needs action. For eNPS, anything above 0 means more promoters than detractors, above +20 is good, and above +40 is excellent.
External benchmarks help set expectations. According to Gallup's employee engagement indicator, 31% of US employees were engaged and 17% actively disengaged as of May 2026. Gallup also reports that managers account for at least 70% of the variance in team engagement, and engaged employees are 47% less likely to be job hunting.
That 70% figure is the reason to read every engagement metric by manager. A company score of 65% can hide one team at 85% and another at 40%. The second team is where the next wave of resignations will come from.
Metric | Needs action | Healthy | Strong |
|---|---|---|---|
Engagement score (% favourable) | Under 50% | 50% to 70% | Over 70% |
eNPS | Below 0 | 0 to +20 | Above +20 |
Survey participation | Under 60% | 60% to 80% | Over 80% |
90-day new-hire retention | Under 85% | 85% to 95% | Over 95% |
Treat these ranges as starting points, not targets set in stone. Your own trend over time matters more than any outside number.
Which engagement metrics should hiring teams track for new hires?
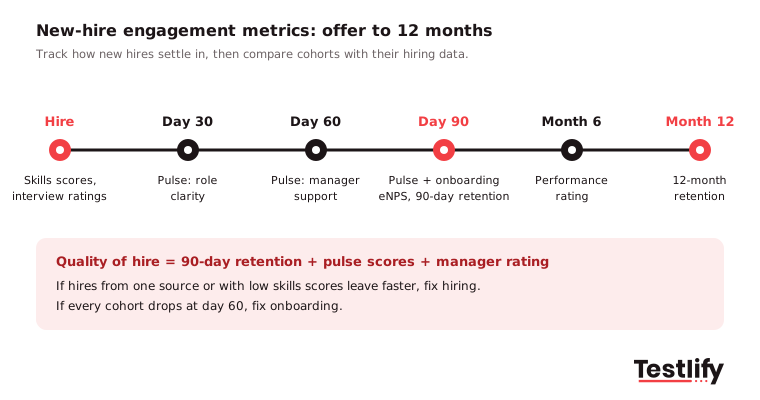
Hiring teams should track four engagement metrics for new hires: 30, 60 and 90-day pulse scores, onboarding eNPS, 90-day retention and 12-month retention. These numbers show whether the people you hired are settling in, and they point back to hiring decisions in a way company-wide engagement scores cannot.
New-hire engagement is where engagement and recruiting meet. When a new hire leaves in the first 90 days, the cause is usually one of three things: the job was not what the ad described, onboarding failed, or the person did not have the skills the role needed. Only one of those is an engagement problem.
The link to hiring quality is already on TA teams' radar. LinkedIn's Future of Recruiting 2025 found that 89% of talent professionals expect measuring quality of hire to grow in importance, yet only 25% feel highly confident they can measure it. New-hire retention is already one of the most used inputs, chosen by 60% of TA pros, next to job performance ratings at 66%.
A simple way to connect the two:
- Tag every hire with their hiring data: Source, assessment scores, interview ratings and time to hire.
- Run a 30, 60 and 90-day pulse: Three or four questions on role clarity, manager support and whether the job matches what they expected.
- Compare cohorts: If hires from one source or with low skills scores leave faster or score lower on pulses, change the hiring process, not the onboarding.
- Report it as quality of hire: Combine 90-day retention, pulse scores and manager ratings. Our quality of hire calculator shows one way to weight them.
For the reasons new joiners disengage early, see how to avoid low employee engagement and early attrition.
What mistakes should you avoid when measuring engagement?
The most common mistakes in measuring engagement are tracking too many metrics, reading only company averages, surveying without acting, and treating engagement as an HR score instead of a manager responsibility. Each one turns engagement data into a report nobody uses.
- Too many metrics: Twenty numbers on a dashboard means no one owns any of them. Promote three to five to KPIs.
- Only reading averages: Engagement drops start in pockets. SHRM, reporting Gallup data, noted that when US engagement fell to 30% in early 2024, the steepest declines came from employees under 35 and fully remote workers. A single company average would have missed both groups.
- Surveying without acting: If people see no change after a survey, participation falls next time. Commit to sharing results and one visible action per team.
- Changing questions every year: New questions break the trend line. Keep a fixed core and rotate only a few items.
- Ignoring the hiring side: If early attrition is high, look at who you are hiring and how, not only at perks. Engagement is also not the same as giving people more control over their work; see what employee empowerment means for that related topic.
Key takeaway: Employee engagement metrics only pay off when they are few, tracked the same way every time, broken down by manager and tenure, and tied to a clear action. The best single habit is pairing every survey signal with the turnover or retention number it should predict.
How does Testlify help connect hiring to engagement?
Testlify helps by giving you structured, comparable data on every hire at the start, so you can later check which hiring signals line up with strong engagement and retention. Skills tests, personality and culture tests, and AI interviews are all scored the same way for every candidate.
- Skills data at hire: Choose from 3,500+ tests across tech and non-tech roles, or build one from a job description, and keep a per-skill score for every hire. Browse the test library.
- Culture and work style: Personality and culture tests, including Big Five and DISC, and situational judgment tests add a view of how people prefer to work.
- Data you can join later: Results export as CSV or PDF and sync with 100+ ATS and HRIS tools, so you can place hiring scores next to 90-day retention and pulse results.
Testlify is a hiring platform, not an engagement survey tool. Use it to make the hiring half of the picture measurable, and your engagement tool for the rest.
Start measuring what matters
Pick five metrics from this guide, set your baseline this month, and read every result by manager and tenure. To make the hiring side measurable too, try Testlify free for 7 days, no credit card required, and see how skills data at hire lines up with the engagement of the people you bring in.
Frequently asked questions

Content Writer
Yashika Khandelwal is a Content Writer with 3+ years of experience creating research-backed content on hiring, talent assessment, and HR technology. She is a registered Organizational Psychologist and subject matter expert who combines behavioral science with practical recruitment insights to produce accurate, evidence-based content.
LinkedInRelated resources
View all
Workplace culture
How to identify flight risk employees: signs, steps and a risk matrix

Workplace culture
How to create an employee recognition program in 9 steps

Workplace culture
How to communicate with Gen Z workers: 9 tips for managers

Workplace culture
Participative Leadership: Meaning, Types, Pros and Cons

Workplace culture
12 Best Employee Engagement Strategies That Work in 2026

Workplace culture
Learning trends for 2026: what HR and L&D teams need to know
Get started.
Hire on proof, not resumes.
Run your first skills-based assessment free — no credit card required.