
Time management statistics: 30 facts for hiring teams in 2026
Thirty sourced time management statistics on interruptions, meetings, low-value work and burnout, and what they mean for hiring teams.

Every candidate says they manage their time well. Microsoft's data shows the average worker is interrupted every 2 minutes.
Below are 30 dated facts from 2024 to 2026 reports by Microsoft, Gallup, the US Bureau of Labor Statistics, Slack, Grammarly and Atlassian. Use them to judge your own team's workload and to decide how to screen for the skill.
Time management statistics measure how people actually spend working hours. The figures cover interruptions, meetings, messages, personal systems and the cost of poor planning.
TL;DR:
- Microsoft's 2025 data shows workers are interrupted every 2 minutes, so focus is the scarce resource, not hours.
- Slack found 41% of desk workers' time goes to repetitive tasks, and Atlassian found teams lose 25% searching for answers.
- Acuity Training found 82% of people have no time management system, so a confident resume claim proves little.
- Gallup puts global engagement at 20% and manager engagement at 22%, which affects how well teams set priorities.
- Of companies with a failed recent graduate hire, 38% cited poor time management, so test the skill with scenarios and timed tasks.
- Several popular statistics are five to fifteen years old, so check the year before you quote a number.
 ChatGPT
 Gemini
 Claude
 Grok
 Perplexity
What are the most important time management statistics in 2026?
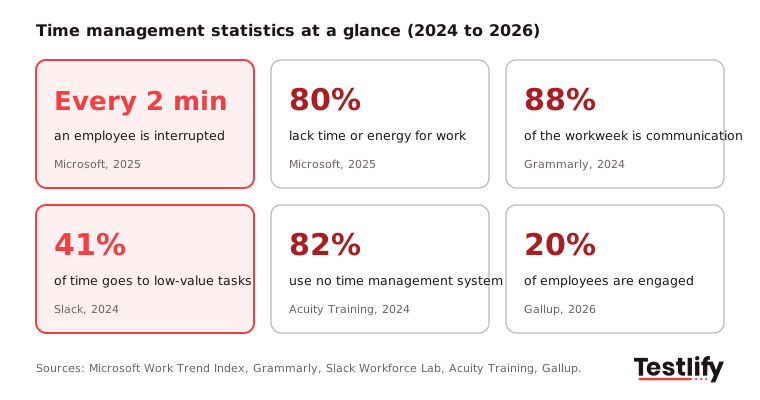
The most important time management statistics in 2026 show a workday broken into small pieces. Employees are interrupted every 2 minutes, 80% of workers say they lack the time or energy to do their job, 41% of time goes to low-value tasks, and 82% of people use no real time management system.
Statistic | Number | Source and year |
|---|---|---|
How often workers are interrupted | Every 2 minutes, 275 times a day | Microsoft, 2025 |
Workers lacking time or energy for their work | 80% | Microsoft Work Trend Index, 2025 |
Share of the workweek spent communicating | 88% | Grammarly, 2024 |
Time spent on low-value, repetitive tasks | 41% | Slack, 2024 |
Time lost searching for answers | 25% | Atlassian, 2025 |
People with no time management system | 82% | Acuity Training survey, 2024 |
Hours worked on days worked (full time, US) | 8.1 hours | BLS, 2025 data |
Global employee engagement | 20% | Gallup, 2026 report |
Hiring managers citing poor time management in failed grad hires | 38% | Resume.org via HR Dive, 2025 |

How much time do workers lose to interruptions?
Interruptions are one of the biggest threats to focused work on any team. Meetings, emails and chat notifications all compete for attention, and each one breaks the flow of whatever a person was doing.
The facts below show how often that happens and why it matters for hiring teams.
- Employees are interrupted every 2 minutes. Microsoft's infinite workday study counts 275 interruptions a day from meetings, emails and notifications.
- 48% of employees and 52% of leaders say work feels chaotic and fragmented. The figure comes from the same 2025 Microsoft research.
- 1 in 3 employees say the pace of work over the past five years has made it impossible to keep up.
- 57% of meetings are ad hoc calls with no calendar invite. Unplanned calls are one of the main sources of interruption, and 1 in 10 scheduled meetings is booked at the last minute.
Pro tip: When you read an interruption statistic, check whether it was measured (telemetry, time logs) or self-reported (a survey). Measured data such as Microsoft's is harder to argue with in a business case.
How much of the workweek goes to communication and meetings?
Communication and meetings take up much of the working week for most teams. Email, chat and calls all compete for the same hours, and every message pulls attention away from focused work.
The facts below show how that load looks in practice, and why it matters when you judge workload and screen for time management.
- 88% of the workweek goes to communication. HR teams, large teams and hybrid workers report more than 40 hours a week on communication alone (Grammarly, 2024 State of Business Communication).
- 100% of knowledge workers have miscommunications at least weekly. One in four have them several times a day.
- 78% of professionals say they communicate more often than before, and 73% use more channels.
- The average worker receives 117 emails and 153 Teams messages a day (Microsoft, 2025).
- Meetings that start after 8 pm are up 16% year over year, and the average employee sends or receives more than 50 messages outside core hours.
- 29% of active workers are back in their inbox by 10 pm (Microsoft, 2025).
- People check email every 101 minutes on average, and 16.6% say they "live in email" (Acuity Training survey of 500 workers, 2024).
How much time goes to low-value work?
Low-value work is the repetitive, avoidable effort that fills a working week without moving real priorities forward. It includes manual admin, status updates and hunting for information.
The facts below show how much of the week it takes and why it matters when you judge workload and screen for time management.
- Desk workers spend 41% of their time on low-value, repetitive tasks. The survey covered 10,281 desk workers in six countries (Slack Workforce Lab, 2024).
- Teams lose 25% of their time searching for answers. Atlassian's State of Teams 2025 surveyed 12,000 knowledge workers and 200 executives.
- Workers spend 91 minutes a day on tasks and meetings that are not important to their role (Acuity Training, 2024).
How many people use a time management system?
Time management systems are the habits and tools people use to plan, prioritise and protect their working hours. Some rely on a formal method, while others use a simple to-do list or react to whatever lands in their inbox.
The facts below show how people organise their time and why it matters when you screen candidates.
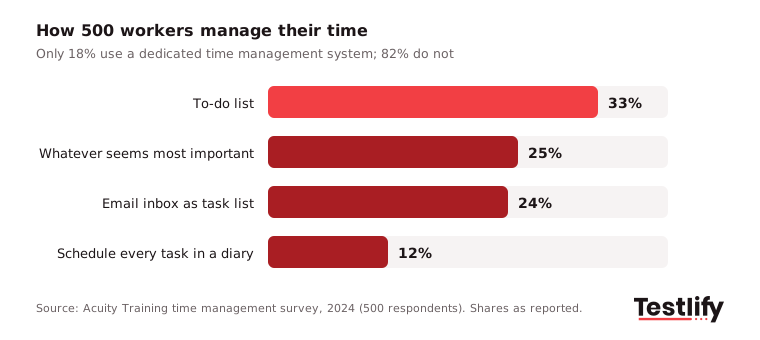
- 82% of people have no dedicated time management system. Only 18% do (Acuity Training, 2024).
- 33% use a to-do list, 24% use their email inbox, 12% schedule every task in a diary, and 25% deal with whatever seems most important at the time.
- Only 20% feel in control of their work every day, while 21% feel in control one day a week or never.
- Half of Eisenhower Matrix users feel in control every day, the best result of any method in the survey. Reacting to whatever comes up scored worst.
- 49% have never audited how they spend their time.
How many hours do people actually work and rest?
Working hours are easy to claim and hard to verify. Official time-use surveys show how people really split their day between work, home and rest.
The facts below come from the US Bureau of Labor Statistics and give hiring teams a realistic baseline for workload.
- Full-time workers average 8.1 hours on days worked: 8.5 hours on a weekday and 5.5 hours on a weekend day (BLS American Time Use Survey, 2025).
- 35% of employed people work at home on days they work, rising to 51% of workers with a bachelor's degree or higher.
- 30% of employed people work on an average weekend day, against 81% on an average weekday.
- Men average 5.6 hours of leisure a day and women 4.8 hours, and watching TV takes 2.6 hours of it.
How does poor time management affect stress and engagement?
Poor time management affects stress and engagement because overloaded people have little room to focus, recover or do their best work. Teams feel it as low energy, missed priorities and disengaged managers.
The facts below show how workload, pressure and engagement connect, and why it matters for the people you hire.
- 80% of the global workforce say they lack enough time or energy to do their work. The survey covered 31,000 workers in 31 markets (Microsoft Work Trend Index, 2025).
- 53% of leaders say productivity must increase, which widens the gap between what companies ask and what people can deliver.
- Global employee engagement fell to 20% in 2025, down from a peak of 23% in 2022, according to Gallup's State of the Global Workplace report.
- Manager engagement dropped to 22%, down nine points since 2022. Managers set priorities for everyone else, so this matters for team time management.
- Low engagement cost the world economy about $10 trillion, or 9% of global GDP, per the Gallup 2026 report.
What do time management statistics mean for hiring?
Time management statistics matter for hiring because they show the conditions every new hire walks into. Busy calendars, constant messages and unclear priorities test how well a person plans, focuses and meets deadlines.
The sections below connect the workplace data to what TA leaders, recruiters and HR teams can do when they screen for the skill.
- 38% of companies that saw a recent graduate hire fail cite poor time management. Lack of motivation, professionalism and phone use were the other top reasons (HR Dive report on the Resume.org survey, 2025).
- 72% of hiring managers say recent graduates often or sometimes struggle to manage their workload, and 60% say they turn in work late.
Put these numbers next to the workplace data above. Employees are interrupted every 2 minutes, most people have no system, and four in ten hours go to low-value work.
For more numbers on how soft skills affect hiring, you can explore our article on soft skills statistics.
A candidate who can prioritize, plan and protect focus time is rare, and the gap shows up fast after the hire. That is why time management belongs in the skills you screen for, alongside the role's technical skills.
Key takeaway: The workday is crowded with interruptions and low-value tasks for everyone. Hiring people who already manage their time well is cheaper than trying to fix the habit after onboarding.
How can hiring teams assess time management skills?
Hiring teams can assess time management skills with a short skills test plus structured interview questions, instead of trusting a line on the resume. The best signals are how a candidate prioritizes competing tasks, plans a day or week, handles interruptions, and meets the deadlines set inside the assessment itself.
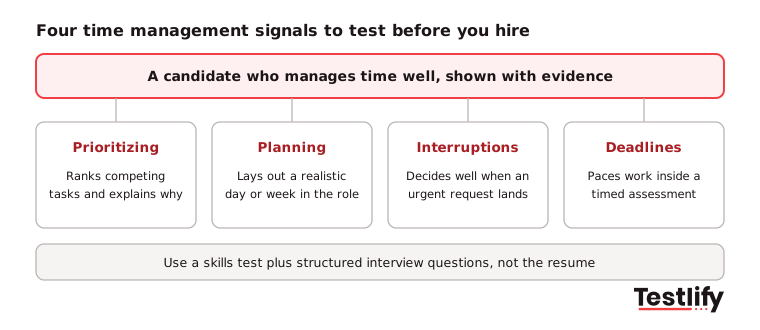
- Prioritizing. Give candidates a set of competing tasks with different deadlines and stakes, and ask them to rank and explain the order.
- Planning. Ask for a plan for a realistic week in the role, including where meetings and focus time go.
- Handling interruptions. Use a scenario where an urgent request lands in the middle of planned work, and score how the candidate decides.
- Meeting deadlines. A timed assessment shows whether a candidate paces their work, not just whether they know the right answer.
Testlify's time management test is a 10-minute situational judgment test: candidates make decisions in workplace scenarios covering task management, personal time management and decision making. It sits in a library of 3,500+ tests, so you can pair it with the role's technical tests in one assessment.
For a full hiring process around the skill, read how to hire candidates with time management skills.
Which time management statistics are out of date?
Many time management statistics that still circulate are five to fifteen years old. Before you quote a number in a deck or blog, check its original year and method.
The table below lists widely repeated figures, where they come from, and what to use instead.
Widely shared statistic | Where it comes from | Use it? |
|---|---|---|
Office workers are productive for only 2 hours 53 minutes a day | Vouchercloud UK office survey, shared since about 2017 | No. Use Microsoft's 2025 interruption data instead |
$588 billion lost to distractions every year | A Basex estimate reported by Reuters more than 15 years ago | No. Use Gallup's 2026 cost of low engagement |
60% of the day goes to "work about work" | Asana Anatomy of Work, 2019 to 2023 editions | Only with the year. Slack's 2024 figure of 41% is newer |
57% of time goes to communicating | Microsoft Work Trend Index, 2023 | Replaced by Grammarly's 2024 figure of 88% (different method) |
23 minutes to refocus after an interruption | University research from about 2008 | Avoid in business content. Quote it as older research if at all |
82% have no time management system | Acuity Training survey, rerun in 2024 | Yes, with the year and sample of 500 |
Ready to see how candidates manage their time?
Our skills-based hiring statistics follow the same rule. Try the time management test on your next open role and compare candidates on how they prioritize and plan.
Start a 7-day free trial of Testlify, no credit card required, and browse the full test library or book a demo with the Testlify team.
Frequently asked questions (FAQs)

Related resources
View all
HR Statistics
Soft skills statistics: the 2026 numbers that matter
HR Statistics
Employer concerns survey 2026: What the data means for hiring

HR compliance
Employee monitoring policy template: free sample and guide
Workplace culture
What is an upskilling strategy? A practical guide for HR teams

Workplace culture
Employee engagement metrics: 12 to track and how to measure them

HR & recruitment
Labor forecasting: what it is and how to do it in 2026
Get started.
Hire on proof, not resumes.
Run your first skills-based assessment free — no credit card required.